Accounting for centroid and buoyancy effects
The pore-pressure changes due to hydrocarbon buoyancy and formation centroid effects can be calculated on the Centroid Buoyancy form (1D MODEL > Pore Pressure > Centroid Buoyancy). You use the Centroid-Buoyancy track to account for the buoyancy effects of fluid zones encountered in the well.
About centroid buoyancy
The centroid is the depth where the pore pressure in a reservoir and the bounding shale are in equilibrium. Above the centroid, the pore pressure in a reservoir is higher than that in the bounding shale. Below the centroid, the reservoir pressure is less than in the shale.
The position of the centroid depends on the pore pressure in the bounding shale and on the type, height and density of the fluid(s) in the reservoir formation(s). Knowledge of the position of the centroid and its pressure is of crucial importance for the safety of the drilling operation. It allows for more accurate pore pressure qualification and mud weight control.
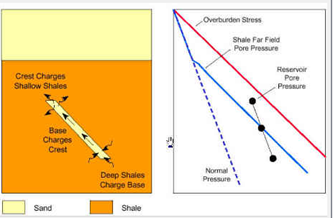
Graphical representation of centroid effect click to enlarge
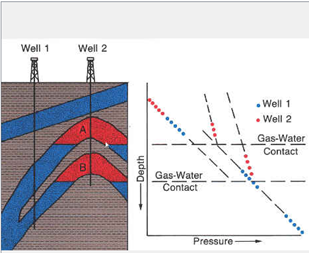
Graphical representation of buoyancy effect click to enlarge
Centroid Buoyancy workflow
On the Centroid Buoyancy form you set up a Centroid Buoyancy model in which you specify formation depth, structure depth data, and fluid model data (fluid types present, height of the fluids column and fluid density). The Centroid Buoyancy model can contain several, unconnected reservoir accumulations. Additionally, the algorithm supports TVD's overlapping structures.
To create a centroid buoyancy model
- Select the interpreted pore pressure to use for the centroid buoyancy model.
- Click Show to open the Structure Definition table, which allows you to define target formation depths and intersections, and the fluid column definition. The table is described in detail below. You also can access the structure definition from 1D Model > Pore Pressure > Centroid Buoyancy.
-
Calculate the Centroid Buoyancy model.
(Re)Calculate When you have entered the settings for the fluid zones, click (Re)Calculate to calculate the centroid of the fluid-filled zones. Once calculated, the pore pressure in the wellbore is adjusted to account for buoyancy effects.
Click after adjustments to recalculate the model.
Final Pore Pressure Displays the final pressure log name once the log has been generated.
- Click Show under step 4, 'Show final pore pressure', to show the Centroid Buoyancy View with the centroid buoyancy regions visualized (in TVD projection).