Mud Weight to Trigger Slip
With the MW to Trigger Slip tool you can analyze the shear slip on fractures that causes the wellbore to transmit fluids. The analysis can provide insight into drilling mud invasion into fractures, when the mud pressure is substantially below the nominal lost circulation pressure which is assumed to be equal to or slightly below S3.
On the form, there are two options - Variable MW and Constant MW
- Variable MW This option accounts for the variable mud pressure in the well which can cause the fracture to slip if it reaches the critical value. The shear slip will happen if the fracture were permeable enough that the fluid pressure on the fracture is equal to the pressure of mud in the well. The fluid pressure in the fracture and in the well is assumed to be isolated from the fluid pressure in the formation. Low values of internal pressure are shown in red colors, as these are the points along the fracture that would be most prone to slip with low mud weights.
- Constant MW In this analysis a fixed mud weight equal to that originally specified on the Model Definition is used, and values of pressure required to cause the fracture to slip are computed for this constant wellbore boundary condition. Note that the mud weight scale is substantially different as the boundary condition defined by the fixed mud weight is quite different. Again, hot colors are low pressures to cause slip. Narrow zones of red colors are outlined, for which the pressure required to cause slip along the fracture is less than the pore pressure. These are identical to the zones within which the original 'single plane of weakness' analysis predicted failure; mud invasion into the fracture is not necessary to cause it to slip within these zones.
Click (Re)Calculate after you select one of the two options above. This will calculate the values for the plot or update the calculations if you have selected one of the other options.
Click Show to open the Elasticity around the hole view with the Plot type preselected as Mud Weight to Trigger slip.
Use the toolbar options on the top of the view to visualize and export the plot information. Using the Options button ![]() on the toolbar, open the input parameters and display settings panes on the right side of the plot. The Input pane lists all the reference parameters used for the calculations, whereas on the Display pane you can show/hide the Stress Crosses on the plot using the checkbox and also change the plot color scale.
on the toolbar, open the input parameters and display settings panes on the right side of the plot. The Input pane lists all the reference parameters used for the calculations, whereas on the Display pane you can show/hide the Stress Crosses on the plot using the checkbox and also change the plot color scale.
The figure below shows an example of a MW to trigger slip plot calculated at the selected depth with variable mud weight. In this case, which was generated with mud weight equal to pore pressure, there would be no pressure increase within the fracture even if the mud were allowed to invade.
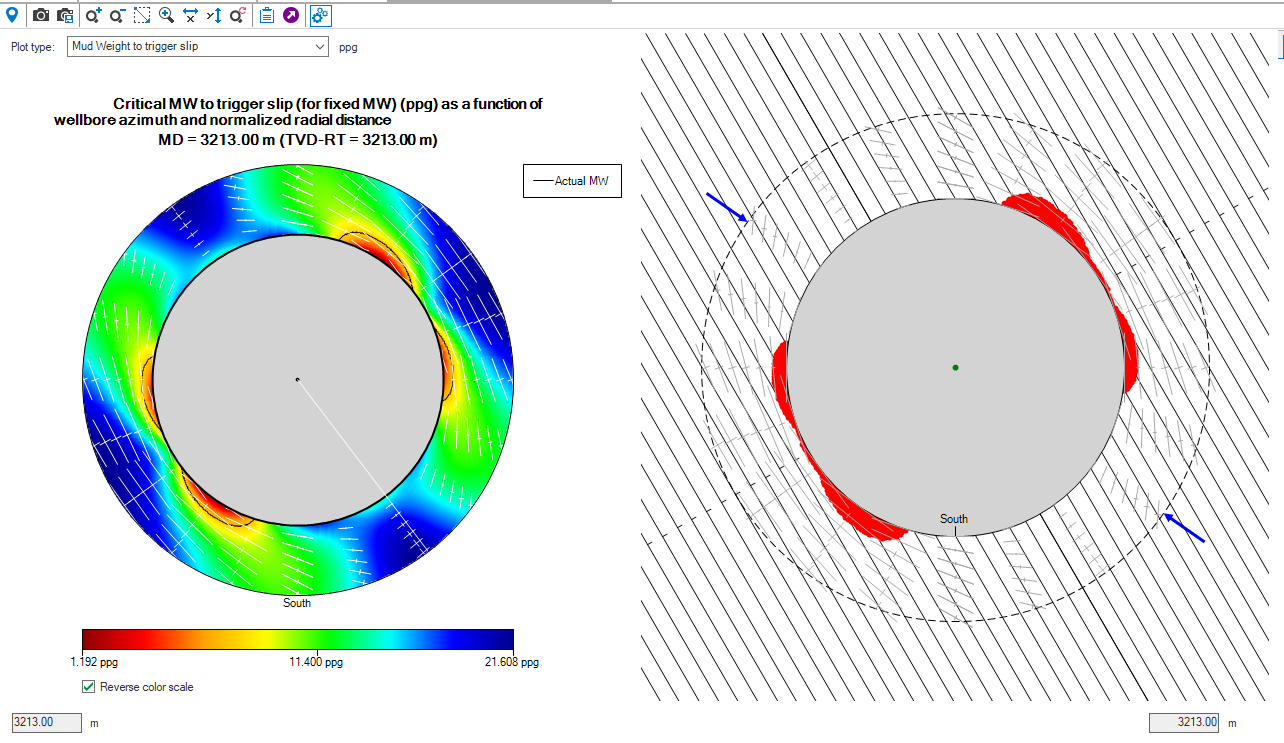
Example of the Elasticity Around The Hole View, displaying the plot for the MW to Trigger Slip, using depth based calculation method with mud weight equal to the pore pressure. click to enlarge