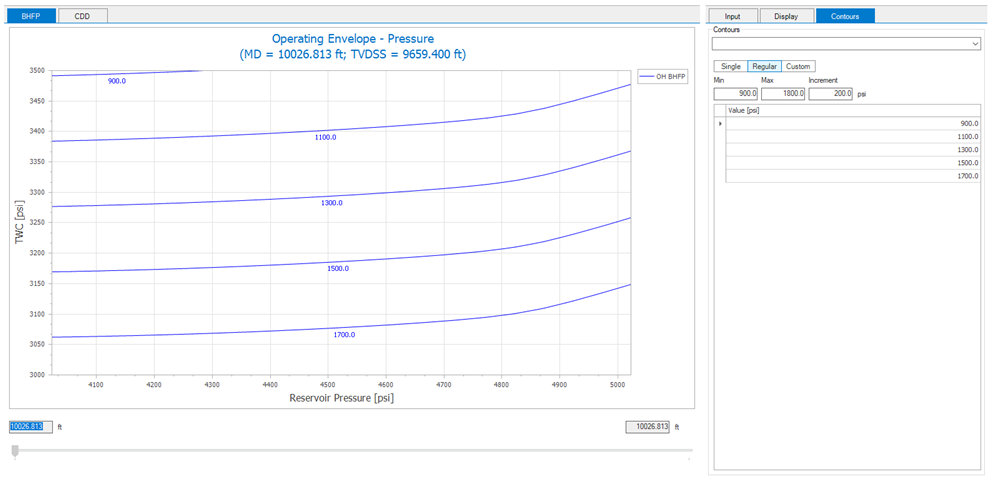
Pressure Crossplot View
Pressure plot or sensitivity plot is another way to interpret the results of the operating envelope. In the Pressure Plot, TWC values are plotted against the reservoir pressure while the contour lines represent the BHFP and critical drawdown for the open hole or cased hole study.
The <display> tab lets you choose which contour plot to display while the <contour> tab lets you define how the contour plots should be displayed. Three options are given for this.