Frequency Plots
Example of a frequency plot. click to enlarge
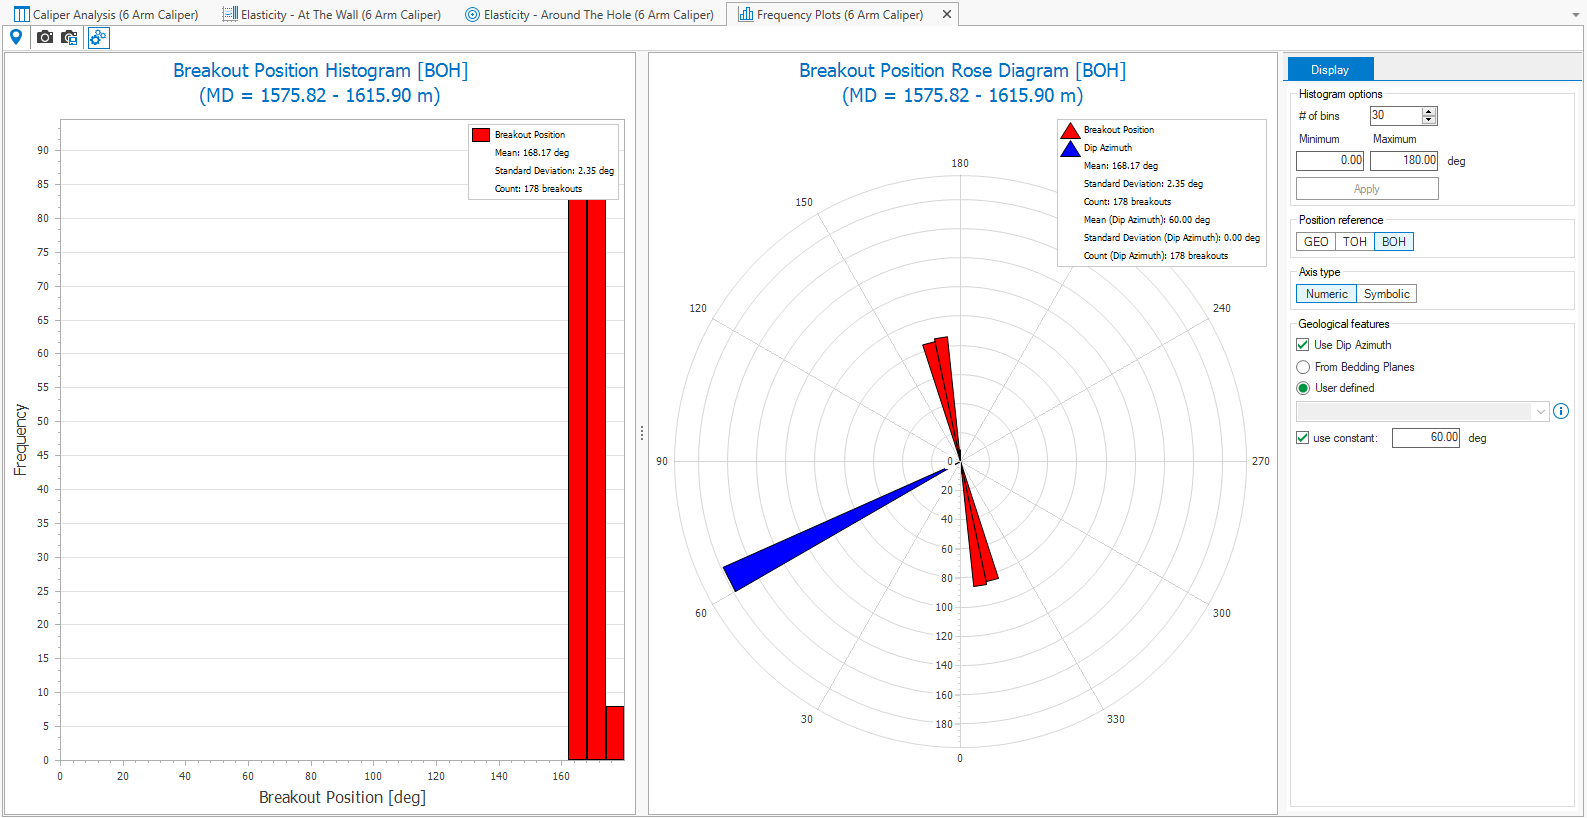
Frequency plots, opened from the caliper strip (caliper > Caliper Analysis > Frequency Plots) show the frequency of breakouts in two ways, as a histogram and as a rose diagram.
You can adjust how the data is visualized in the plots using the context menu of the plots, or by using the options in the Display panel, opened from the toolbar (![]() ).
).
Frequency Plots toolbar

|
Probe tool When activated, hover over the data in the view to display the object and property data. |

|
Copy view to clipboard Copy the current view to the clipboard for use in other applications. |

|
Save view to file Save the current view to a file with a name and location you specify. |
|
|
Options Shows all the display options. |
Context menu options
Changing the display options with the context menu is applied both in the histogram and in the rose diagram. Some of the options, position reference and axis type, are also available in the display panel. Updating such an option in the context menu, also updates the display panel options, and vice versa.
Annotation (histogram only, RMB on a bin) Select to show the number of breakouts per bin.
Axis type Choose between numeric or symbolic.
Numeric Breakout direction is listed using numbers.
Symbolic Breakout direction is listed using letters.
Position reference Select the breakout reference. When you change the reference, there is no data conversion.
Geographic North
Top of Hole
Bottom of Hole
Options Opens a dialog that lets you customize the visual aspects, see chart options.
Export Exports the frequency data in column format to the clipboard for further use or analysis.
Display Options
Changing the display options is applied both in the histogram and in the rose diagram. Some of the options, position references and axis type, are also available in the context menu. Updating such an option in the display panel, also updates the context menu.
Histogram options
# of bins You can change the number of bins using the up /down arrow, or by clicking in the entry field and typing a new value.
Minimum / Maximum The min and max value for the x-axis. You can change the value by clicking in the entry field and typing a new value.
Changes you make in the histogram options field are not applied until you click the Apply button. Both the histogram and the rose diagram are updated.
Position reference Select the breakout reference. When you change the reference, there is no data conversion.
GEO (Geographic North)
TOH (Top of Hole)
BOH (Bottom of Hole)
Axis type Choose between numeric or symbolic.
Numeric Breakout direction is listed using numbers.
Symbolic Breakout direction is listed using letters.
Geological features This option is only applicable to the rose diagram. You can use this option to display the dip azimuth of the bedding planes. When you display dip azimuth, the legend for the rose diagram is updated accordingly. Choose how to specify the dip azimuth:
From Bedding Planes Select this option to use dip azimuth of the bedding planes (you can review the values on the Advanced Mode form (advanced stress & failure > Setup > Advanced Mode/ wellbore stability > Setup > Advanced Mode).
User defined Select from two options. Either you select a log from the drop-down list below (only logs that are of the type azimuth or dip azimuth are listed), or you select to use a constant. When you select constant, the entry field below is enabled and you have to enter a value.