Multi Well Chart View
The Multi Well Chart View, opened with the Multi Well Chart button (data > 1D Case > Tools), opens initially blank. In this view, you can visualize multiple logs for multiple wellbores in one chart, by selecting these items in the JewelExplorer. A chart is created per log property type, e.g. all gamma ray logs are displayed in one chart, and all resistivity logs are displayed in another chart. You can display any type of log. Tabs at the top of the view make it quick and easy to shift from one chart to the other. Once displayed in the Multi Well Chart View, you can change the display settings with a dedicated display section in the view itself.
To display logs for multiple wells
- In the JewelExplorer, select the wells of interest by checking their checkboxes.
- Under All Logs, select the logs you want to display. The logs are displayed for all the wellbores that have this log. If you want to display a log only for a particular wellbore, select the log in the Logs folder under that wellbore in the JewelExplorer. Each log property type has its own chart. You can use the tabs at the top of the view to display another log chart.
- Initially all logs in a chart are displayed in the same color. For better visualization settings, open the Display section using the Options button
 in the toolbar.
 - Change the color of the logs per wellbore so you can easily distinguish between the logs of the different wellbores.
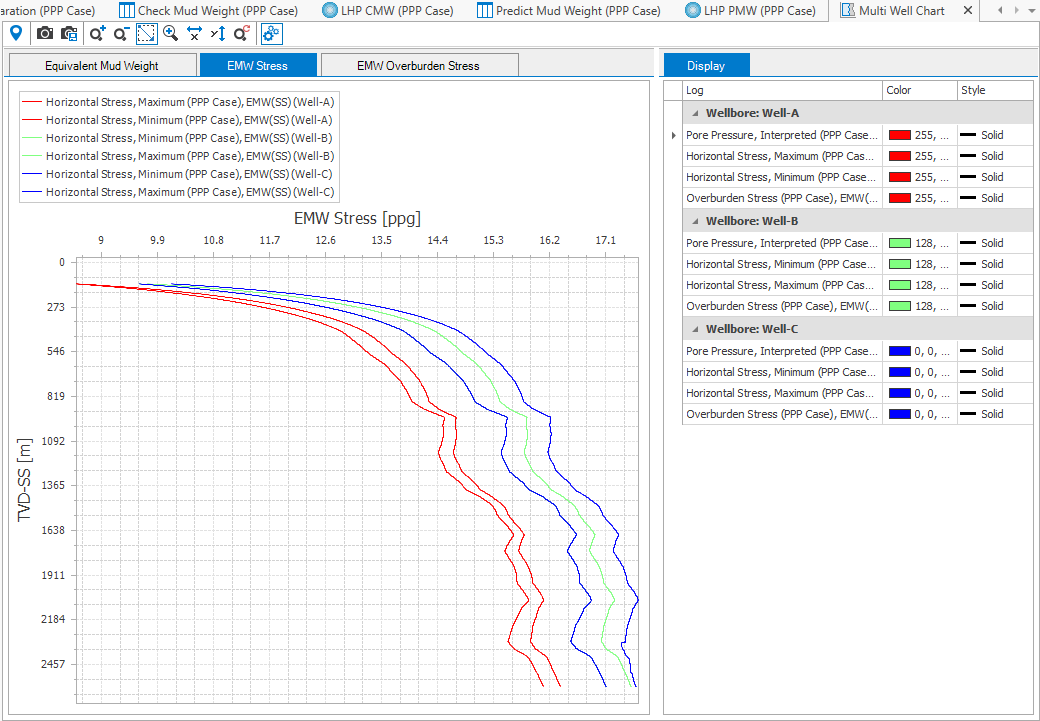
Example of a multi well chart. click to enlarge
Use the context menu to access the following options:
Depth Projection Select which depth projection to use in the chart. Choose between MD and TVDSS.
Lock Axes Select to prevent the axes from being changed after a recalculation or after adding a log that is out of the current scale.
Chart Options dialog On the dialog, you can change the display settings for the chart, pane, axes, series, titles and legend. Use Export from the context menu to copy the series data of the plot to the clipboard, which can be used in other applications.
Multi Well Chart toolbar

|
Probe tool When activated, hover over the data in the view to display the object and property data. |

|
Copy view to clipboard Copy the current view to the clipboard for use in other applications. |

|
Save view to file Save the current view to a file with a name and location you specify. |

|
Zoom in Incrementally zoom in on the view. |

|
Zoom out Incrementally zoom out on the view. |
|
|
Zoom rectangle Turns the cursor into a zooming tool. When this option is active, click and drag a box around the data you want to view in better detail. |
|
|
Zoom on both axes Incrementally zooms in equally along both axes. |
|
|
Zoom on the horizontal axis Zooms the view only along the horizontal direction. |
|
|
Zoom on the vertical axis Zooms the view only along the vertical direction. |
|
|
Reset zoom Clear all zoom changes. |
|
|
Options Shows all the display options. |