Stacked Well Plots
Example of stacked well plots for 6 arms caliper log data. click to enlarge
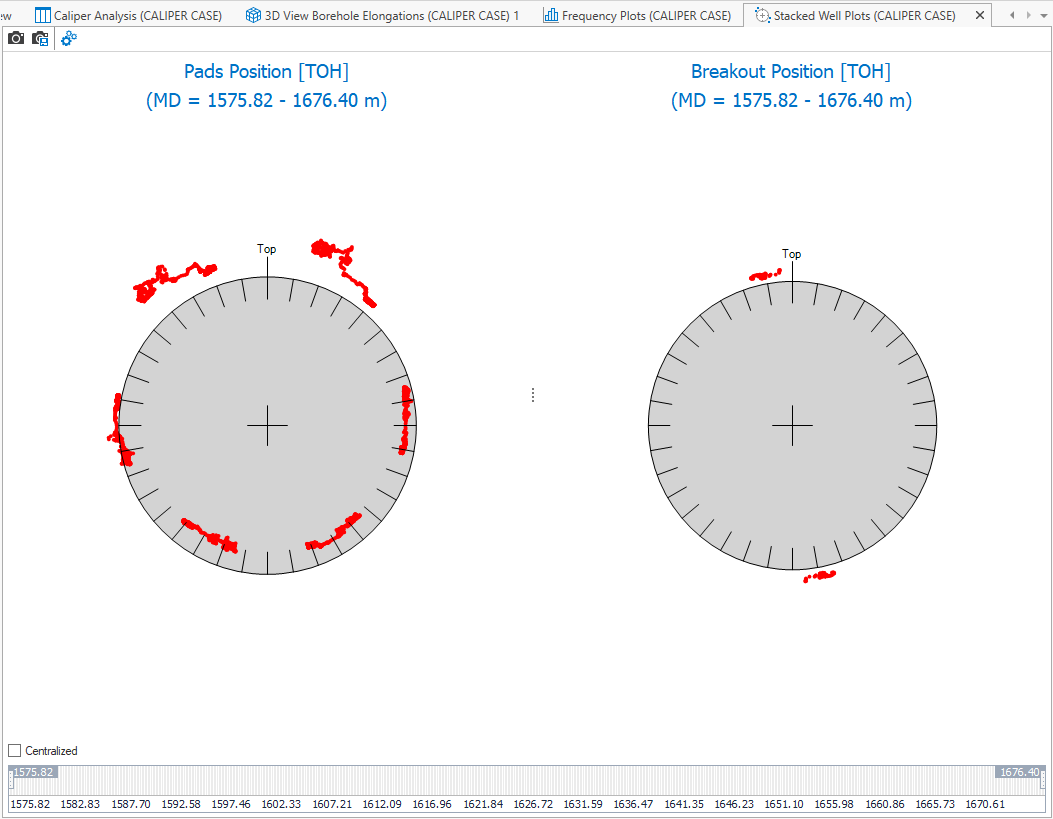
Stacked Well Plots, opened from the caliper strip (caliper > Caliper Analysis > Stacked Well Plots) show the pad position and breakout position mapped onto a cross section of the wellbore. Individual pads and breakouts are shown as red dots, and the depth range of the analyzed interval is displayed at the bottom of the plot view.
You can adjust how the data is visualized in the plots using the context menu of the plots, the slider at the bottom of the view, or by using the options in the Display panel, opened from the toolbar.
The Stacked Well Pads Position Plot shows the azimuths of the caliper pads over the analyzed depth interval. In case of six-arm caliper analysis, JewelSuite Geomechanics can implement a centralization procedure described by Jarosinski and Zoback (1998) and Jarosinski (1998). You can select or deselect the Centralized option using the check box in the bottom left corner of the view. Additional blue symbols indicating the locations of the tool axis are displayed when this option is selected.
The Stacked Well Breakout Position Plot shows the breakout position over the analyzed interval.
Stacked Wells Plots toolbar

|
Copy view to clipboard Copy the current view to the clipboard for use in other applications. |

|
Save view to file Save the current view to a file with a name and location you specify. |
|
|
Options Shows all the display options. |
Context menu options
Changing the display options with the context menu is applied in both plots.
Position reference Select the breakout reference. When you change the reference, there is no data conversion.
Geographic North
Top of Hole
Bottom of Hole
Unit (slider only) Select a unit in which the depth values will be displayed.
Format (slider only) Select the notation number of decimals, and between normal or scientific notation.
Display Options
You can change the log that is used for the Pads position using the one of the other logs listed in the drop-down list.
Depth Interval Slider
At the bottom of the view, the depth interval is visible as a slider. By default, the complete depth interval is selected. You can change the depth interval for which data is shown in the view using the sliders on both sides. When you hover over one of the sliders, your mouse pointer changes into a bidirectional arrow. Hold down the left mouse button and drag to the desired depth.