Display settings
Using the Display Settings form (Home > Settings), you can set your preferred defaults for various functions, from wellbore thickness to axis color and from 3D view background color to tri-mesh boundary color. These settings are saved to your machine and modify only default values. Existing values in an open view are not overwritten, the new display settings will only be applied to new views. At the bottom of the form there are two buttons: Reset and Reload. Click Reset to set the user settings back to default, click Reload to reload the user settings. Click Apply to make the changes in the display settings.
When you select categories in the tree to the left, the panel to the right shows the settings that you can change.
Application
Here you can change the prefix and or suffix connection text and overlay icon (for copied views) settings. If you use the Take Screenshot ( ) or Save screenhot to file (
 ) options in the toolbars of the 2D View or 3D View, and check the box Add overlay icon when copying a view, an icon is added to the copied file. With the corner and margin settings you determine where in the view the icon is placed.
To add your own icon, select the Custom overlay icon option and click the ellipsis button  to open the file selection window. Select the file and click Open to add the file.
Panels
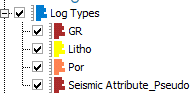
The options in the Panels section let you determine how the JewelExplorer will show logs and if you want the JewelExplorer to highlight a selected object from a view or not. To sort the existing logs per property, check the first option. The JewelExplorer will show logs and property template information.
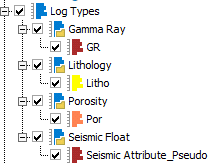
If this option is unchecked, all logs are listed individually in alphabetical order.
When you check the Expand related folder option, clicking an object in the active view will both expand the related folder and highlight the selected object in the JewelExplorer.
Views
Most of the options in the 3D View section are for changing the display colors, the font size and color of annotation and whether or not you want it to be always visible.
The display settings for the Well View allow you to personalize the appearance of tracks within the view. You can configure the following default settings: track width, font for legends, scale and units. Once these parameters are modified, the new settings will automatically apply to all newly created tracks within the Well View.
General options relating to chart display can also be defined. Chart options specific to the various charts can be set from within the chart itself, see Statistical Analysis chart options. The display settings only allow you to adjust appearance. To edit the text of the title, the axes or the legend, you must use the chart options.
Objects
For each of the objects included in this category you can control how the object is visualized in a 3D View. Most options allow you to control the default color and size of the object.
Import & Export
Allows you to specify basic import and export options for well markers, seismic volumes and wells.