Log property context menu
The following context menu descriptions are for logs in the JewelExplorer and 2D/3D View.
Hide (Only for context menu in a view) Hide it in your view.
Show Legend Show or hide a legend for it in your 3D View.
Image (Image logs only) Change the display for image logs
( ) in 3D View.
Smoothed (Static) Displays a smooth image for the entire image log data (default).
Smoothed (Dynamic) Displays a smooth image for the selected dynamic range. Adjust the Dynamic Window Size in the Property Inspector.
Unsmoothed Displays the raw image log data.
Display Settings
Color Pick a color to display it in the view.
Transparency Make it semi-transparent. Adjust the opacity value from the Property Inspector.
Fill Type Set the fill type to No Fill (only the curve is shown), Property Colors (the fill uses property colors, to indicate log values) or Object Colors (the fill uses the color of the log curve object).
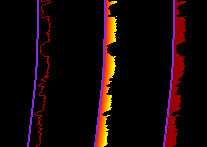
Left to right: No Fill, Property Colors and Object Colors click to enlarge
Fill Direction Set the fill direction of the log curves: Fill to min, Fill to max, Fill to zero, or Column. Fill to zero is useful for filling either the positive or negative values for logs with both positive and negative values, such as residual logs.
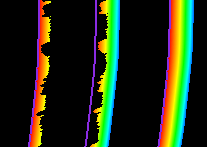
From left to right: Fill to min, Fill to max, Column click to enlarge
Fill Interpolation Style Set the fill interpolation style to horizontal or vertical.
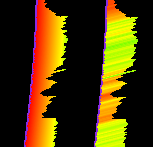
Vertical (left) and horizontal click to enlarge
3D Log Display the log in either 1D or 3D. When your wellbore is highly deviated, the 3D display in the transition zone between the vertical and horizontal part of the wellbore is only properly handled when the 3D log threshold angle is set to 0 degrees. The default value for the threshold angle, after importing the logs to the solution, is 5 degrees. You can change this angle in the Property Inspector, having the Wells folder selected in the JewelExplorer.
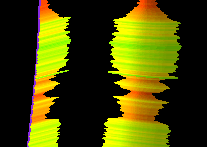
1D (left) and 3D click to enlarge
Multiple Log Views Arrange multiple logs to be displayed separately.
Edit... Opens the Logs form where you can edit existing logs, see Creating and editing logs.
If log is non-editable, the View... item displayed. It will open Logs form in read-only mode.
Duplicate Create a copy and place it in the same folder in the JewelExplorer.
Create
Create a Point Set Create a point set.
Create Markers (discrete logs only) Create a marker set with a marker for every value of the discrete log.
Colorset Control
Show as Residual Show as a residual log.
Increase Color Gain Increase the color gain.
Decrease Color Gain Decrease the color gain.
Tools and Operations
Crop Log to Valid Data Range Show only valid data values for the log.
Fill Gaps Fill gaps in the log using linear interpolation..
Remove Ranges (discrete logs only) Remove consecutive ranges with equal values.
Property Calculator Open the Property Calculator with the property selected as 'Target Property.' If the Property Calculator was used to create the property, the Property Calculator will open with the expression that created the property.
Statistics
Create Histogram Create a histogram of the full log.
Create Histogram (<active 1D case name>) Create a histogram using Lithology Model from the active 1D Case as a filter.
Create Scatter Chart Show a scatter plot for your log.
View History Open the Audit Trail to view a history of changes, including user name, date, context, workflow process, workflow panel, and description. For more on the Audit Trail, see Using the audit trail.
Report
Property Statistics Report Create a report of the statistics of the property.
Export
To joalog Export to a JewelSuite log format.
To Clipboard Place on the clipboard so you can paste it into another application.
To ascii Export to an ASCII text file format.
Delete Delete the object from the solution. Depending on the type of object, geometric representations, subfolders or objects it may contain are deleted as well.