Creating and editing logs
You can manually create new logs or edit existing ones for each well in your model using the Logs button in the Log Tools button group of the data > Wells strip. To do this, you must have some wells and wellbores already defined or imported into your model. If the data is in an Excel™ spreadsheet, you can copy and paste the log data into the log value table.
You can
The Logs form consists of three distinct sections; the log header section at the top of the form, the settings section on the left side of the form and the log values table on the bottom right. In the header section you may specify information such as the wellbore and log name. In the settings section you can edit property type, general, time and scale settings. At the bottom right of the form the properties and log value table can be configured.
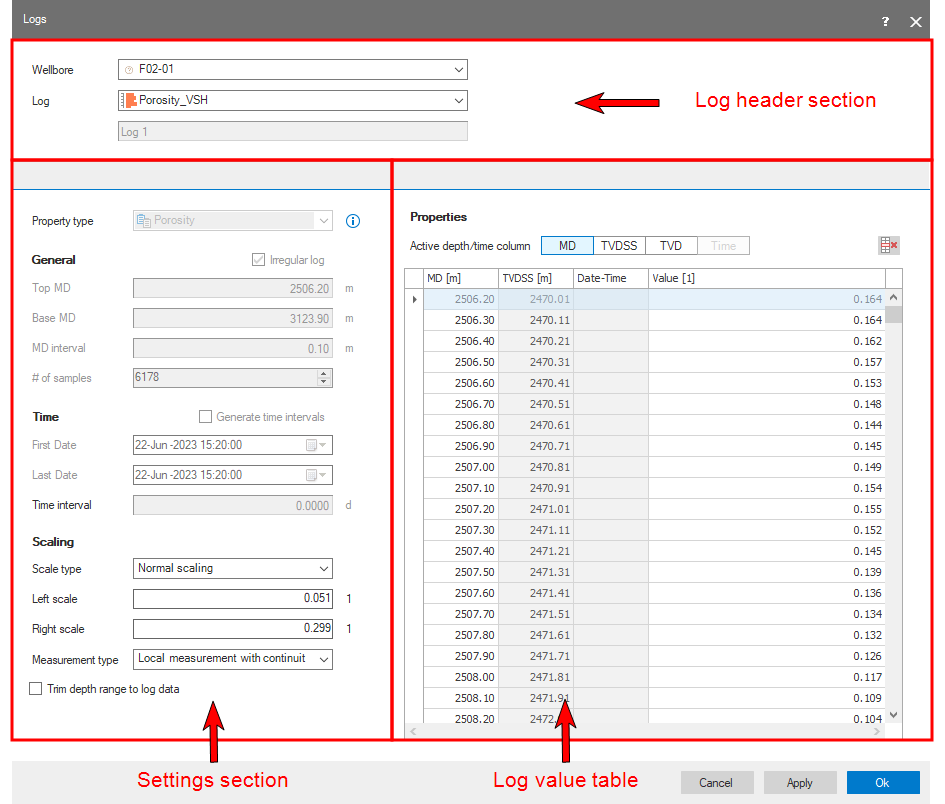
The Logs form click to enlarge
Wellbore Select the name of the wellbore. When selecting a wellbore, the start and end MD are automatically set to the wellbore start and end MD.
Log Select an existing log from the drop-down list. If you want to create a new log, select Create new from the drop-down list. The Log name field is now editable. Enter a unique, alphanumeric name.
Settings section
On the left side of the form you can specify the following settings:
Property type If you create a new log, you need to assign a property type from the drop-down list. This will automatically update the log value table with the corresponding unit (if applicable).
General Enter the wellbore depth (along hole) for the top and base of the well log data. These values should be valid values for the wellbore, meaning that these top and base values should be between the start and end depth values of the wellbore. Enter either the vertical sampling interval or total number of samples for the log; the other value is calculated automatically at regular intervals. For instance, if the log covers 1000 meters and you enter a sampling interval of 5 meters, the application will calculate that there should be 201 samples in the log (including the first sample). The number of samples and depth of each sample is automatically shown in the depth columns of the table.
Scaling Use the drop-down list to specify the type of scale for this log: Normal, Reverse, or Logarithmic. Left and right scale are the log boundaries (min + max) and can be less than the minimum and more than the maximum. For example, a porosity log with data values between 0.03 and 0.35. Since porosity is a percentage, you can set the left/right scale from 0 and 1. These values are used when rendering the logs in 3D View and the Well View. If the left and right scale span up the lateral scale of the rendering area these values will influence the rendering width of the log.
In case of normal and logarithmic scale type, the left scale is a minimum value, the right scale a maximum. In case of a reverse scale, the left scale is a maximum and right scale a minimum.
Select the type of measurement the log data represent. Choose from:
- Local measurement: no continuous log is created, only point data. Select this option when measurements are believed to be irregular between the sampling points.
- Local measurement with continuity: a continuous log is created. Select this option when measurements are believed to be smooth between the sampling points.
- Boundary measurement: a blocked log is created from top log interval downwards. Log value is given to interval below data point. Select this option when measurements are located at the top of intervals with constant values.
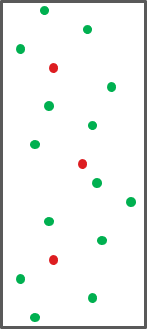
Schematic example of what your data might look like. The red dots are known sample points, the green dots are unknown values between samples. When measurements are believed to be irregular between the sampling points, select local measurement. click to enlarge
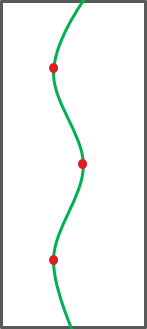
Schematic example of what your data might look like. The red dots are known sample points, the smooth green curve is unknown. When measurements are believed to be smooth between the sampling points, select local measurement with continuity. click to enlarge
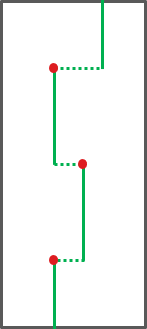
Schematic example of what your data might look like. The red dots are known sample points, the green lines are assumed constants between sample points. When measurements are believed to be located at the top of intervals with constant values, select boundary measurement. click to enlarge
Check the 'Trim depth range to log data' option to remove any undefined or invalid values from the top and base of the log to minimize the size of the log.
Log Value table
Before you enter your data, select the Active depth/time column. The input modes are as follows: MD (measured depth), TVDSS (True Vertical Depth Sub Sea) or TVD (True Vertical Depth) and Time.
In the Properties table, enter the value recorded at each depth for the log. If you enter a value less than the left scale, the left scale will be set to this value. If the value is higher than the right scale, the right scale will be set to this value. In case of reverse scale, this is done the other way around.
When finished entering log data, click Apply or OK to add the new or updated log to your model. If there are problems with data consistency, an error message will appear. Once you enter a complete set of consistent data, the log can be visualized in all views that show log data.
Like in most tables in JewelSuite Geomechanics, you can rearrange the order of the columns. If you want to copy and paste data into this table, you can move the MD column next to the 'Value' column so that you can paste data into both columns simultaneously.