The Regional Data View
TVDSS property tables can be used when calculating the overburden density and as a representation of the regional overburden stress. Depending on your needs, the tables can be used directly in calculations or they can be converted to logs and then used in the workflow. The Regional Data View
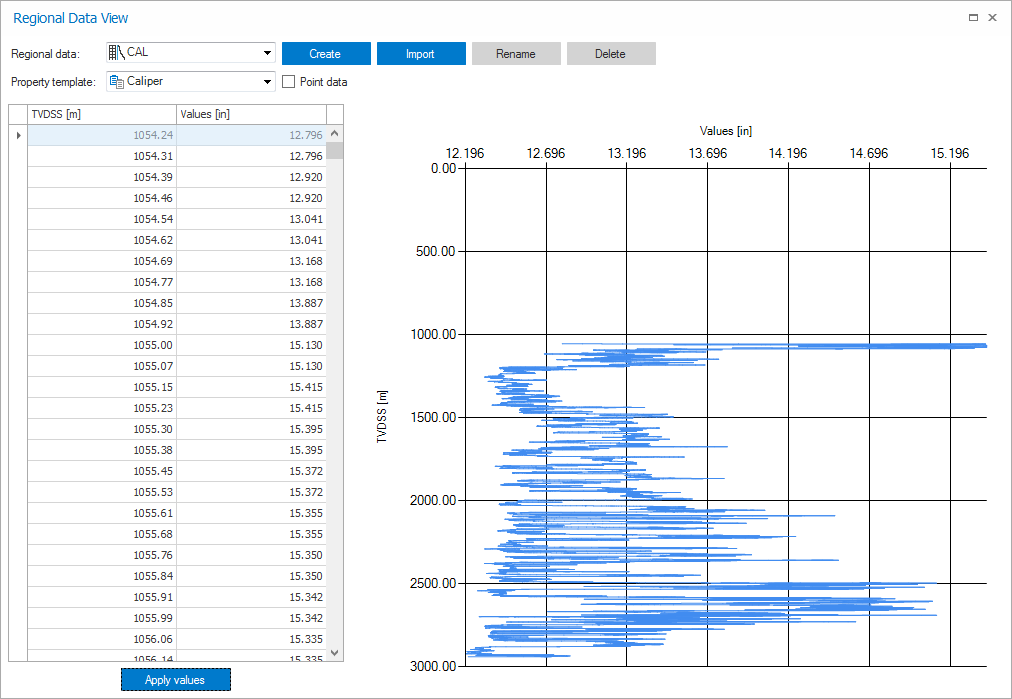
Data for these tables can be input manually, imported or converted from other logs. In all cases, the data table on the left of the view is used to input and interact with the raw data, while a graphical representation of the data is displayed to the right so that you can observe the trend. When you have finished creating and reviewing the data, the resulting TVDSS property table can then be used on the Overburden form or even converted into a log on the Regional Data form.
You can input your data by entering it manually or by copying and pasting from an external application.
- Click Create to generate a new table.
- Click Rename and provide a name in the Regional data text box.
- Select a property template to assign to the property table. Assign Overburden Density if the data is to be used in the Overburden form. Select Overburden Stress if the data is to be used to represent the overburden stress. Otherwise, select the desired property template.
- Enter the data in the table by hand or by pasting it in from your external application.
- Click Apply values to accept the data. When you click this button for the first time, a plot of the data appears to the right of the table. Subsequently clicking Apply values updates the plot with any changes to the data. If changes are made to a table that is already being used as part of a calculation, such as in the Overburden form, you will need re-run any calculations that your change may have affected.
Regional data in the form of a *.las file can be imported and, if necessary, modified.
- Click Import to open an import dialog.
- From the dialog, select the *.las file and click Open to open the validation dialog.
- After confirming the property template and unit click OK to import the data. Both the table and the plot populate with the imported data.
- If necessary, the data in the table can be modified as needed. After making changes ensure that you click Apply values to affect the change.
Any log in your solution can be converted to regional data on the Regional Data form.
- On the Regional Data form, on the Logs -> Regional Data tab, select the target well and check the box for each of the logs that you want to convert to a TVDSS property table.
- Click Convert. The converted logs appear in the Regional Data View and can be selected in the Regional data drop-down list. You can modify the template and data as needed.
TVDSS property tables can be renamed and deleted in the view as well.
To delete a table:
- Select the table in the Regional data drop-down list.
- Click Delete and click Yes at the confirmation dialog.
To rename a table:
- Select the table of interest in the Regional data drop-down list.
- Click Rename and type in a new name in the dialog that appears.
- Click OK when finished to update the name.
Regional Data View controls
Regional data Contains any existing data tables in the project. The table you select in this step becomes the active table.
Property template Contains all of the available property templates to create the data as.
Create Opens a new table that immediately becomes active.
Import Opens the import dialog so that a *.las file may be imported as regional data.
Rename Allows the active table to be renamed.
Delete Deletes the active table.
Point data When checked, displays the table data as point data.
Data table The data table accepts depth measurements and values. Right-clicking either of the column headers allows you to change the units for the column, if necessary.
Apply values Clicking this button accepts any changes to the regional data and applies them to the plot display. A plot of the data appears the first time this button is clicked. Thereafter, clicking this button updates the plot with changes that have been made to the table.