Thickness Table
The Thickness Table allows you to view information on the thicknesses of zones as measured between selected markers along wellbores. From this view you are able to see the maximum, minimum, median and average values for the following projections: Vertical thickness (the measured thickness between markers along wellbores), TVDSS (True Vertical Depth Subsea), MD (Measured Depth along wellbores), TVT (True Vertical Thickness) and TST (True Stratigraphic Thickness). For cases where you have more than one TVT/TST projection, the last projection that has been calculated for the markers is used. These projections can be applied to the table via the context menu, which can be opened by right-clicking in the view and selecting one of the projections from the Value set of options.
The Thickness Table shows all of the horizon, intrusion, and unconformity markers (in stratigraphic order) and wellbores that are currently checked as visible in the JewelExplorer. This is an important distinction to note, as only those objects that are selected in the JewelExplorer while the Thickness Table is open will be counted and used in the thickness calculations. You can change which markers and wellbores are visible by checking/unchecking their visibility in the JewelExplorer, similar to the Well
The following information is available for each marker. Depending on the thickness or depth display selected, the content of the table varies.
- Marker Set – The name of the marker set that the marker belongs to.
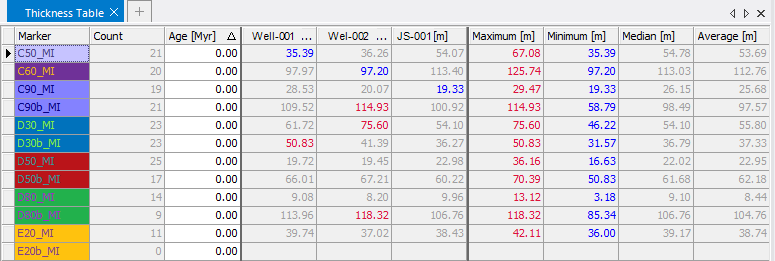
- Marker - The name of the marker.
- Wells - The number of wellbores that the marker has been picked for.
- Wellbores (one column for each wellbore) – The selected wellbores for which you are looking at the marker thicknesses. The value under each wellbore shows the thickness between the specific top marker and the next visible marker below it. If the table is set to display depth this value shows the specific depth of the marker instead of the thickness.
- Maximum - If MD thickness is selected: the maximum thickness between two markers on the selected wellbores. The thickness is displayed in the cell of the shallowest marker of the two. This value is indicated in red in both this column and under the specific wellbore where it is found. If the table is set to display MD, this value shows the maximum marker depth along the wellbore. This value is indicated in red in both this column and under the specific wellbore where it is found. If the table is set to display TVDSS, this value shows the maximum subsurface depth of the marker. This value is indicated in red in both this column and under the specific wellbore where it is found.
- Minimum - If MD thickness is selected: the minimum thickness between two markers on the selected wellbores. The thickness is displayed in the cell of the shallowest marker of the two. This value is indicated in blue in both this column and under the specific wellbore where it is found. If the table is set to display MD, this value shows the minimum marker depth along the wellbore. This value is indicated in blue in both this column and under the specific wellbore where it is found. If the table is set to display TVDSS, this value shows the minimum subsurface depth of the marker. This value is indicated in blue in both this column and under the specific wellbore where it is found.
- Median – The median thickness between markers for a top on the visible wellbores. If the table is set to display depth this value shows the median marker depth for the tops.
- Average – The average thickness between markers for a top on the visible wellbores. If the table is set to display depth this value shows the average marker depth for the tops.
- The cell coloring is done in the following manner: all cells which have a negative depth are colored with a red background. The maximum and minimum values in the table are marked with a red and blue font respectively.
Switching between displays
To switch between the different thickness and depth displays, or to hide specific markers or wellbores, right-click in the view and use the context menu.
Hide Marker Hides the marker corresponding with the selected row from the view.
Hide Wellbore Hides the wellbore corresponding with the selected column from the view.
Value Allows you to set the values displayed in the view. Displays are as follows:
MD Thickness Displays the measured thickness (as measured along the wellbore) between the marker displayed in the view and the marker displayed directly below it in the next line of the view for the selected wellbore. It is the difference between the two marker MDs.
TVDSS (True Vertical Depth Subsea) Displays the vertical, subsurface depth of the marker.
MD (Measured Depth) Displays the depth of the markers as measured along the selected wellbore. When MD is displayed you can edit the MD values from this table.
Assign thickness values to selected tops Generate thickness property for markers based on the thickness values in the table.
Create Zone log Creates an interval log based on markers defined in the wells. See chapter Well Correlation / Zone Log creation.
More options for sorting data in this table are available by right-clicking the column header area.