Thickness/Trend Map
The Thickness/Trend Map is a dedicated view that opens automatically when you are working in one of the following workflows:
- The Thickness Maps workflow (prepare > Thickness Map > Thickness Maps)
- The Facies Trend Maps workflow (model > Facies > Facies Trend Maps)
In the Thickness/Trend Map view you can use the editing tools to create and edit constraints that are used to interpolate your thickness maps or facies trend maps. Constraints are for example user-defined data points that are incorporated during data interpolation. For more information on this, see Graphically creating and editing constraints.
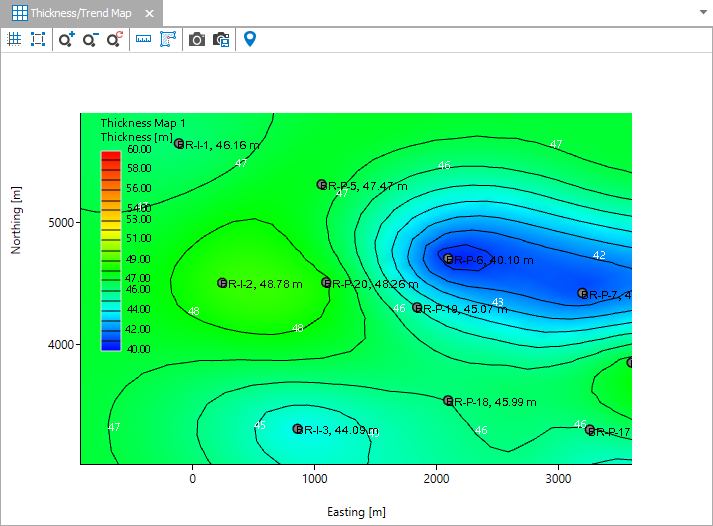
A Thickness/Trend Map displaying a thickness map. click to enlarge
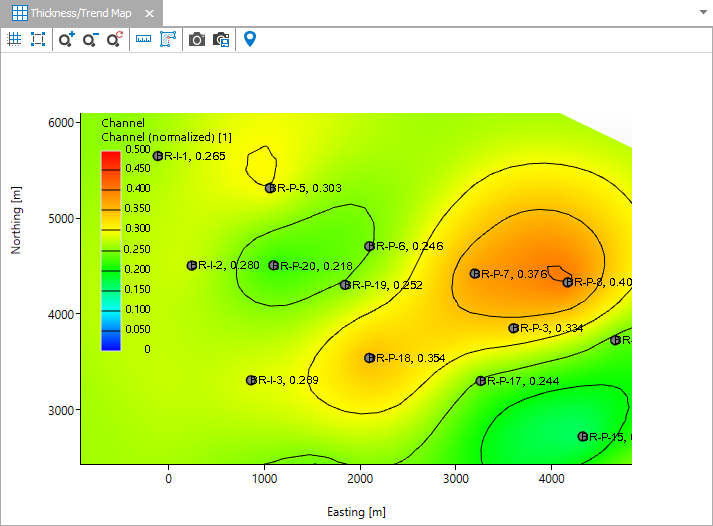
A Thickness/Trend Map displaying a facies trend map for facies class 'Channel'. click to enlarge
Context menus
Most operations in the Thickness/Trend Map are performed by right-clicking and making a selection from the context menu. All object based context menus are the same as in the 3D View (see Using the object context menus).
The Thickness/Trend Map contains a toolbar that you can use to control the view. To learn more, see 2D View toolbar.