Bowers cross plot - Velocity vs Density
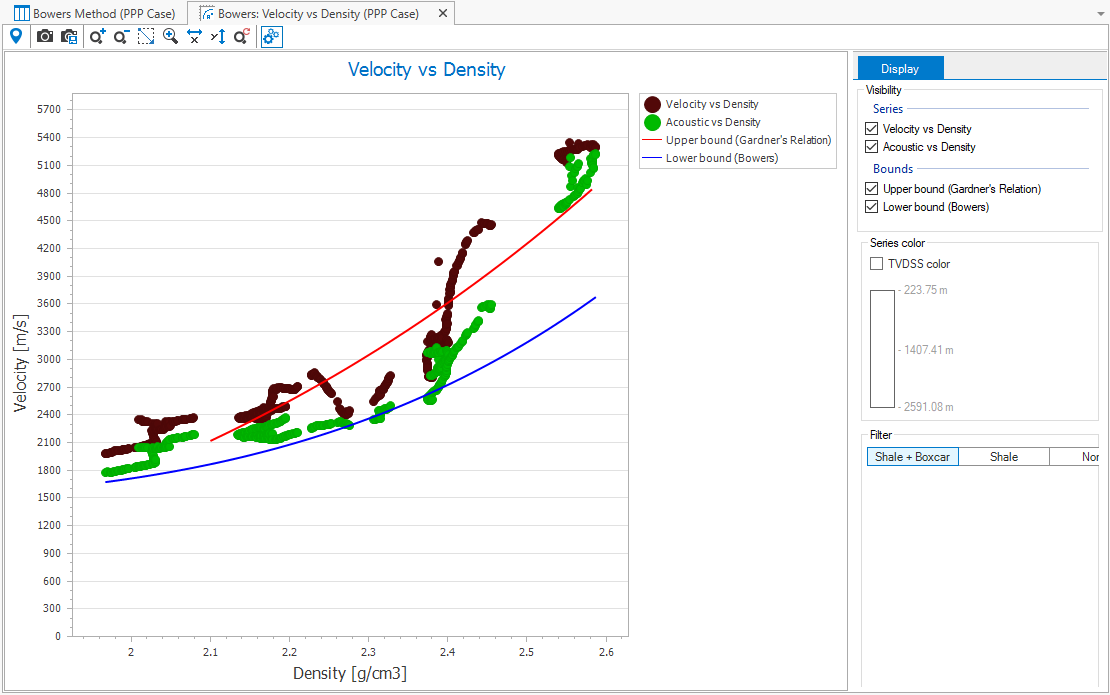
The Velocity vs Density cross plot with velocity and acoustic log data displayed along with the Bower's upper and lower bounds click to enlarge
The Velocity vs Density cross plot displays the velocity and acoustic data selected in the Input Logs and Filtering form. The cross plot allows you to have an initial check on the occurrence of unloading. With this information you can decide if the Bowers Method is the correct approach for modeling the pore pressure. The cross plot can be opened via the Input Logs and Filtering form in the 1D Model > Pore Pressure sub-strip.
When specifying the log data to be used as the input for the Bower's Method calculation it is important to quality check and verify the data before proceeding. This cross plot displays the original composite logs in their log colors as defined in the Property Catalog, though a TVDSS overlay can be applied so that depth can also be considered in your data check. The logs can be filtered using lithology and/or boxcar filters and you can elect to display the data unfiltered. To aid in the check of your Velocity vs Density cross plot, the Bower's lower bound and Gardner's Relation upper bound can be displayed.
Bowers: Velocity vs Density cross plot toolbar
The following options can be accessed via the toolbar located just above the view:

|
Probe tool When activated, hover over the data in the view to display the object and property data. |

|
Copy view to clipboard Copy the current view to the clipboard for use in other applications. |

|
Save view to file Save the current view to a file with a name and location you specify. |

|
Zoom in Incrementally zoom in on the view. |

|
Zoom out Incrementally zoom out on the view. |
|
|
Zoom rectangle Turns the cursor into a zooming tool. When this option is active, click and drag a box around the data you want to view in better detail. |
|
|
Zoom on both axes Incrementally zooms in equally along both axes. |
|
|
Zoom on the horizontal axis Zooms the view only along the horizontal direction. |
|
|
Zoom on the vertical axis Zooms the view only along the vertical direction. |
|
|
Reset zoom Clear all zoom changes. |
|
|
Options Shows all the display options. |
View context menu
Right mouse click anywhere in the view to activate the context menu:
- Use Lock Axes from the context menu to prevent the axes from being changed after a recalculation.
- Use Options from the context menu to open an new dialog. On this dialog, you can change the display settings for the chart, pane, axes, series, titles and legend.
- Use Export from the context menu to copy the series data of the plot to the clipboard.