Adjusting the calculated pore pressure
You calculate the pore pressure from the user-defined curves and display it in the Interpreted Pore Pressure track in the Pore Pressure Prediction view.
- For onshore wells, the default pore pressure is zero for depths above the water table.
- For offshore wells, the pore pressure is fixed as the regional water density from mean sea level to the mud line.
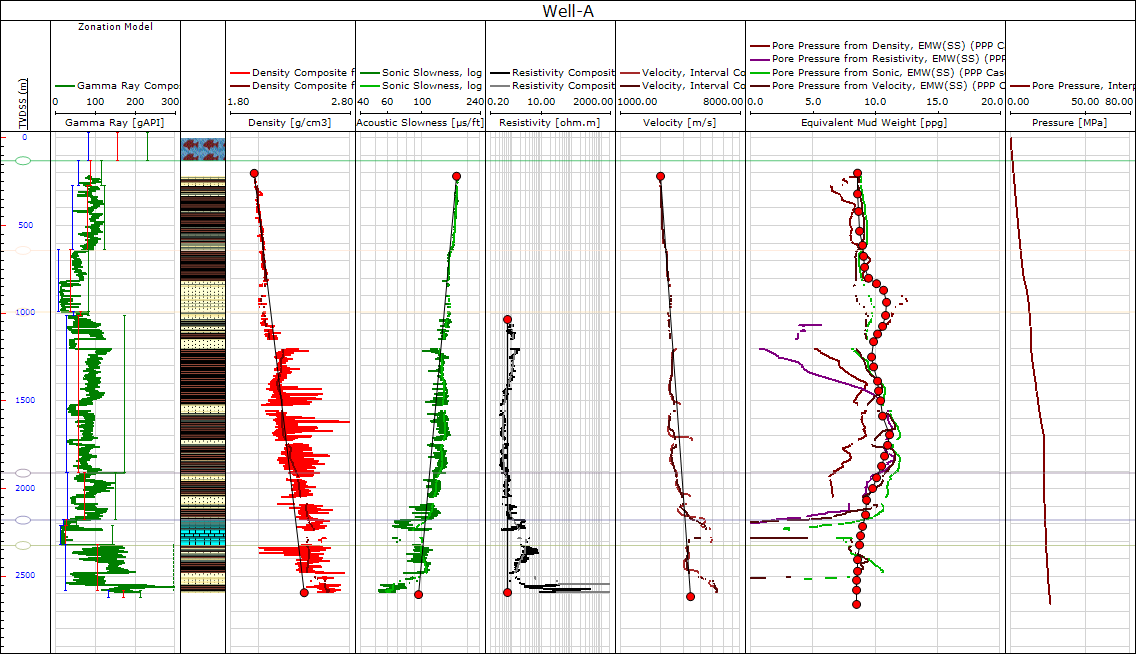
Example Pore Pressure Prediction view with a pore pressure interpretation and resulting Pore Pressure, Interpreted log click to enlarge
Drawing the interpreted pore pressure
When you first open the view using the Show button under 'Interpret Pore Pressure' on the Pore Pressure Calculation form, the calculated pore pressures in the Calculated Pore Pressure track probably will not completely agree with one another. To get a better match, you can reposition or adjust the parameters of the trend lines in the source tracks until you are satisfied with the pore pressure results. By default, the Create custom trend option in the logarithmic track is selected when you open the Pore Pressure Prediction view. Although you can adjust linear trend line points when the Create custom trend option is selected, an inadvertent click could result in a new point being added to the trend line. Therefore, it is suggested to turn off the Create custom trend option when you are adjusting trend line points. Also, for convenience, set the lock icons in the Calculate steps to the open position so that you can immediately observe the effect of the trend line adjustments in the Calculated Pore Pressure track
After you have adjusted the trend lines properly, a user-defined pore-pressure profile can be drawn in a similar manner to that of the linear normal compaction trend lines. Like these lines, the user-defined pore-pressure profile is a point-to-point curve that begins at the water table for onshore case studies, and from the mud line for offshore case studies
To draw the interpreted pore-pressure profile, activate the Edit Custom Trend tool in the Editing Tools and click at the desired depth and pore pressure in the calculated pore pressure track to start the interpretation. Construct a profile by clicking multiple points on the pore pressure curves. As you add more points they connect to create a continuous curve. For more information about creating custom trend lines, see Creating a Custom Trend Line.
After you create the profile, you can edit the points that define the curve by dragging the interpretation points to new locations. If the lock icon in Step 5 is in the open posture, an Interpreted Pore Pressure curve is automatically shown in a separate track and any change you make to the points of the profile immediately update the interpreted pore pressure curve.