Comparison of UCS models for sandstones
The figures below show comparisons between different sandstone models. Porosity-based models are shown in figure A. The modified Vernik (black curve) and GMI-Phi (blue curve) models have as much as 30% different UCS predictions for sandstones with medium porosity range (10–15%) with the modified Vernik model predicting higher UCS values. For high-porosity sandstones (Phi > 27%), the modified Vernik model predicts a lower UCS and above 35%, it predicts negative UCS values. Therefore, the GMI-Phi model appears to be better for high porosity sandstones. The GMI Jizba-Phi model (red curve) shows a very flat curvature above 15% porosity and gives very high UCS compared with those derived from the other porosity models. The fact that Jizba’s samples were tight sandstones with porosity less than 18%, along with the shape of curve, reveals that the GMI-Jizba-Phi equation is not applicable to high porosity rocks.
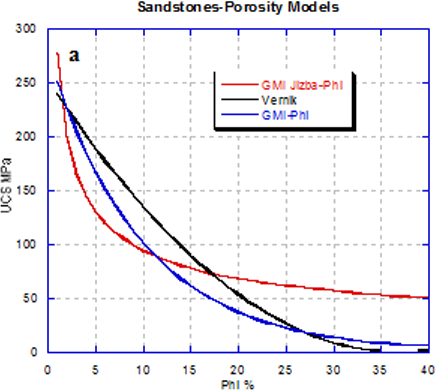
Porosity-based UCS model click to enlarge
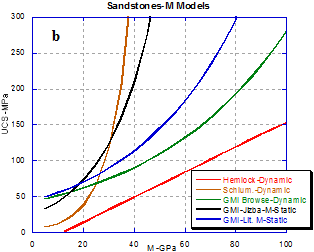
M-based UCS model click to enlarge
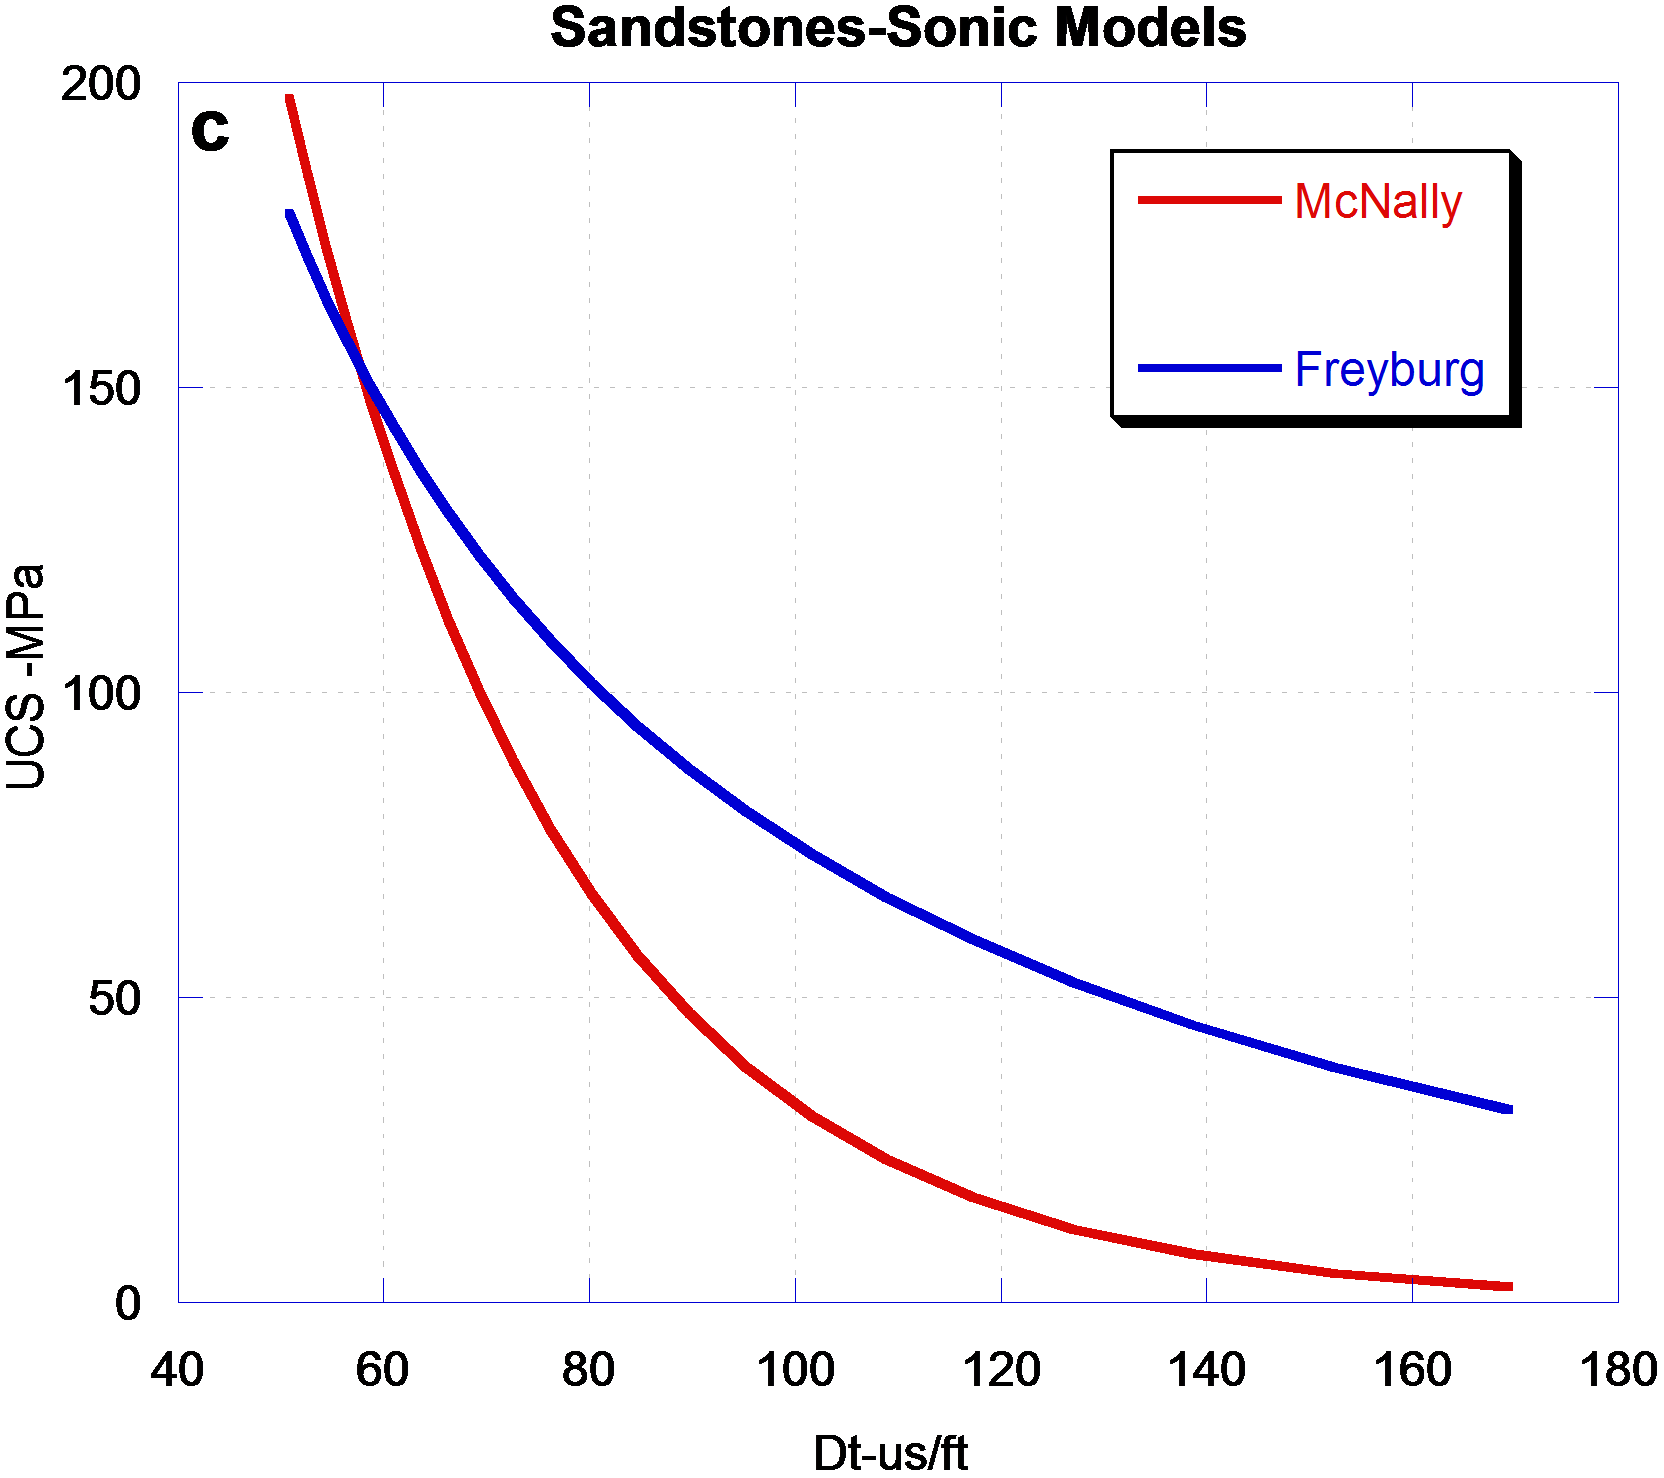
Acoustic-based UCS model click to enlarge