Creating and adjusting trend lines
You can draw either custom (linear) trend line as a single line or as a segmented line, or non-linear trends, such as, exponential, power, and logarithmic trends.
Creating a custom (linear) trend line
First, activate Edit Custom Trend tool in the Editing Tools. Then click in the desired track. From there, the next click anywhere in the track creates the next node in the line. Double-click to end the trend line (custom trend line option remains active). You can adjust the line by clicking and dragging any of the individual nodes, or by clicking in the track and adding additional nodes.
After you turn off the custom (linear) trend line option, you can drag the line across the track. For more information about adjusting the trend line points, see Adding points via context menu.
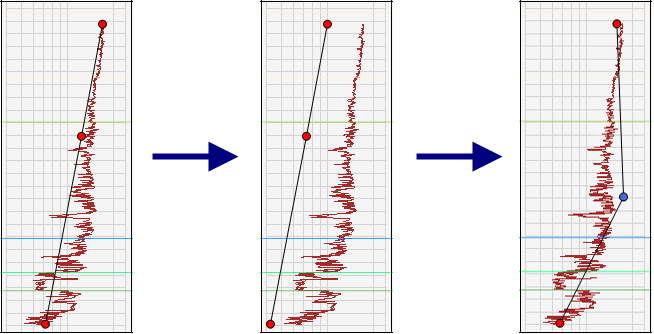
A complete trend line adjustment (center) as well as an individual node adjustment (right) click to enlarge
Because NCTs are valid only on a true vertical depth scale, the depth track is defaulted to display TVD. If you change the depth track to MD, trend line creation is disabled.
Overlapping segments
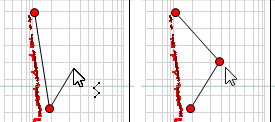
Attempting to draw an overlapping segment will result in a new line being drawn that prevents the overlap, as seen in the example above click to enlarge
The application does not allow user-drawn segments to overlap. If you draw an overlapping segment, an automatic adjustment occurs that corrects the overlap by redrawing the segment lines between the neighboring nodes. In the example below the third node is added to the trend line such that an overlap occurs. Upon placement of the node, a new segment line is drawn between the first and second (newly added) nodes, and second and third nodes.
Undo/Redo for custom trend lines
The undo and redo functionality (maximum of 5 actions) applies to custom trend line operations, including trend line movement and end point or line point adjustments.
Display custom trend lines in the Well View
The application supports the creation of multiple cases for the same wellbore, allowing you to create different interpretations of your data. In the Well View, you can display custom trend lines that you have already created in other cases, instead of recreating them. This feature is only applicable to cases that are associated with the same wellbore.
- In the Well View, right-click in the track and hover over the Source 1D Case option. A list of the other cases associated with the same wellbore appears.
- From the list, select the case from which you want to display the trend lines. The trend lines appear in the Well View.
An important consideration when using this feature is that the custom trend lines displayed from other cases are read-only. In addition, new custom trend lines can not be drawn while the other case trend lines are displayed. This prevents unintended modifications to the displayed trend line.