The Observed Breakout view
click to enlarge
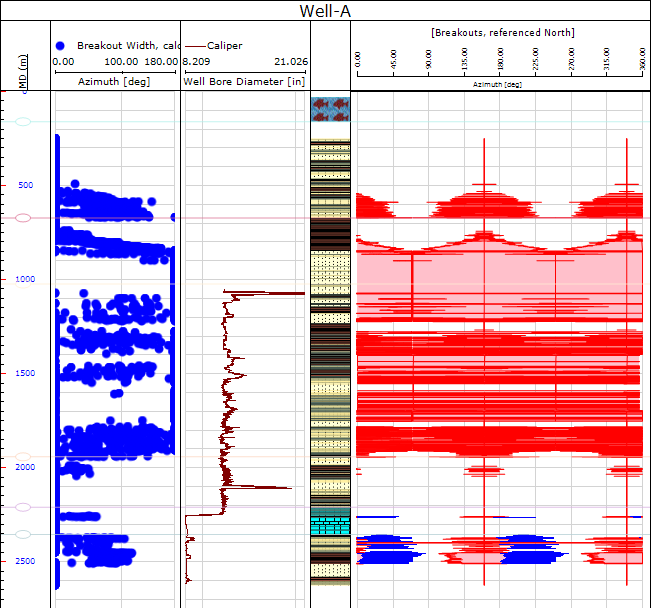
You use the Observed Breakout view, which you can open by clicking Show/Refresh at the bottom of the Observed Breakouts form, to display a plot comparing predicted and observed breakouts. Imported or created breakouts are plotted in blue while the predicted breakouts are plotted in red. The caliper log, if selected in the Observed Breakouts workflow form, appears as an additional track in the view.