The JewelSuite Geomechanics workspace
The JewelSuite Geomechanics workspace click to enlarge
At each stage throughout your work, the application aims to provide the functionality you need as and when you need it. Reports, views and tools relevant to your analysis are readily available at each step of the process so that you can complete your work quickly and easily.
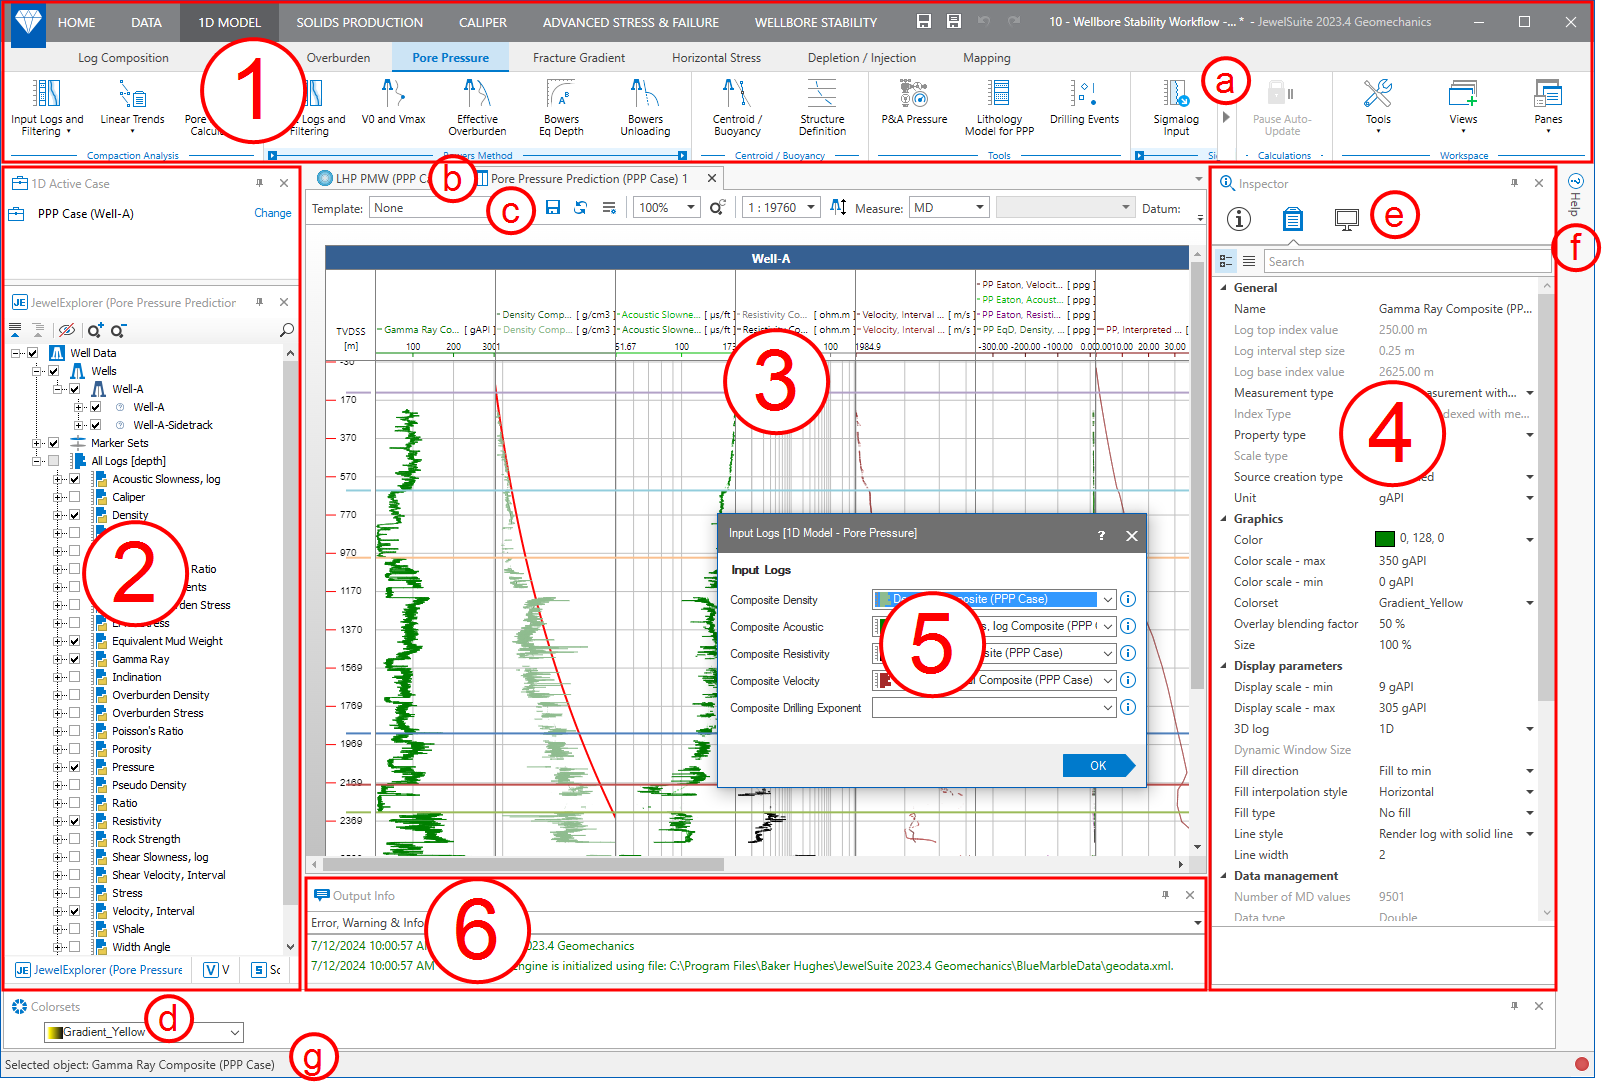
As you work through all the steps, you will often follow sequences of actions in a particular order as part of a workflow. The Strip (1) at the top of the application is intended to be your guide through these workflows as well as giving you access to the functionality and tools you may need.
At the top of the Strip are the main items. Home is where you perform general tasks, such as opening and saving files, managing your settings and accessing the documentation. When you need to import, create or export any data, you will use the Data strips 1D Model is where you follow all the steps to calculate rock mechanical properties and overburden, reliably predict abnormal pressure, and calculate horizontal stresses and fracture gradient.
The solids Production strip provides a step by step guided workflow to create well centric analytical sand production predictions for open hole and cased hole completions.
With the caliper strip you can perform a rapid breakout analysis. The results are presented in a comprehensive set of plots.
The Advanced Stress & failure strip is an integrated environment for assessing stress and wellbore stability. It is designed to aid with analysis of the relationship between in-situ stress and compressive, tensile, and shear failures in vertical and inclined boreholes. The strip provides several easy-to-use program modules for constraining in-situ stress and predicting wellbore stability.
The Wellbore Stability strip provides a workflow to analyze wellbore stability from well logs and drilling data.
When you select one of these main strips, sub-strips will appear. These are ordered from left to right in the sequence that you will typically follow.
As you click each sub-strip, the bottom part of the strip will show buttons relating to that sub-item. The buttons are arranged in groups. On the left is usually a workflow group, which contains a sequence of steps to complete what is required under that sub-strip. Where you are in this workflow at any particular time is highlighted. After the workflow group are various tools that may also be useful to you. On the right, and available at all times, is the Workspace group, which allows you to show or hide the various panes and gives you access to the various floating tool palettes.
If your window is not wide enough to display all the buttons in the Strip, small arrows will appear (a) that you can click to reveal the hidden parts.
On the left of the screen is the explorer area (2), where the JewelExplorer (a key organizational and visualization tool) and 1D Active Case explorers are shown. You can switch between these using the tabs at the bottom of this area. In the center of the screen is the view area, where you can visualize your data and models. You can have various views open at the same time and switch between them using the tabs at the top of the view area (b). At the top of each view is a toolbar (c) with buttons for various options and tasks you may want to perform while displaying the view. At the right side of the screen is the inspector area (4). You can view detailed information and settings in this area by clicking the buttons at the top of the pane (e). Click the Object Inspector  icon to show the displays settings of the object selected in the view. Click the Property Inspector
  icon to view detailed information about any item you have selected in the JewelExplorer or have clicked on in your view.
Click on items at the far right edge of the application (f) to display them, such as the Dynamic Help - so called because its content changes as you click on buttons or objects in the application. It is intended to give you immediate access to much of the information you might need regarding the functionality and tools you are using.
When you click on a button in the Strip or other parts of the application, a form (5) will often be shown to allow you to enter selections and other information relating to the current task. If the form is part of a workflow, the OK button will have an arrow, and when you click this the form relating to the next step in the workflow will be automatically shown (clicking the Apply button will apply your changes, but the next form will not automatically be shown).
At the bottom of the screen is an area (6) where warning and information messages, other explorers and controls may be shown. You can select which one to display using the tabs at the bottom of the pane (d).
Finally, the status bar at the bottom of the screen (g) provides information about the status of the application such as loading progress, current objects, calculation status and recent updates.