Visualizing seismic data in the 3D View
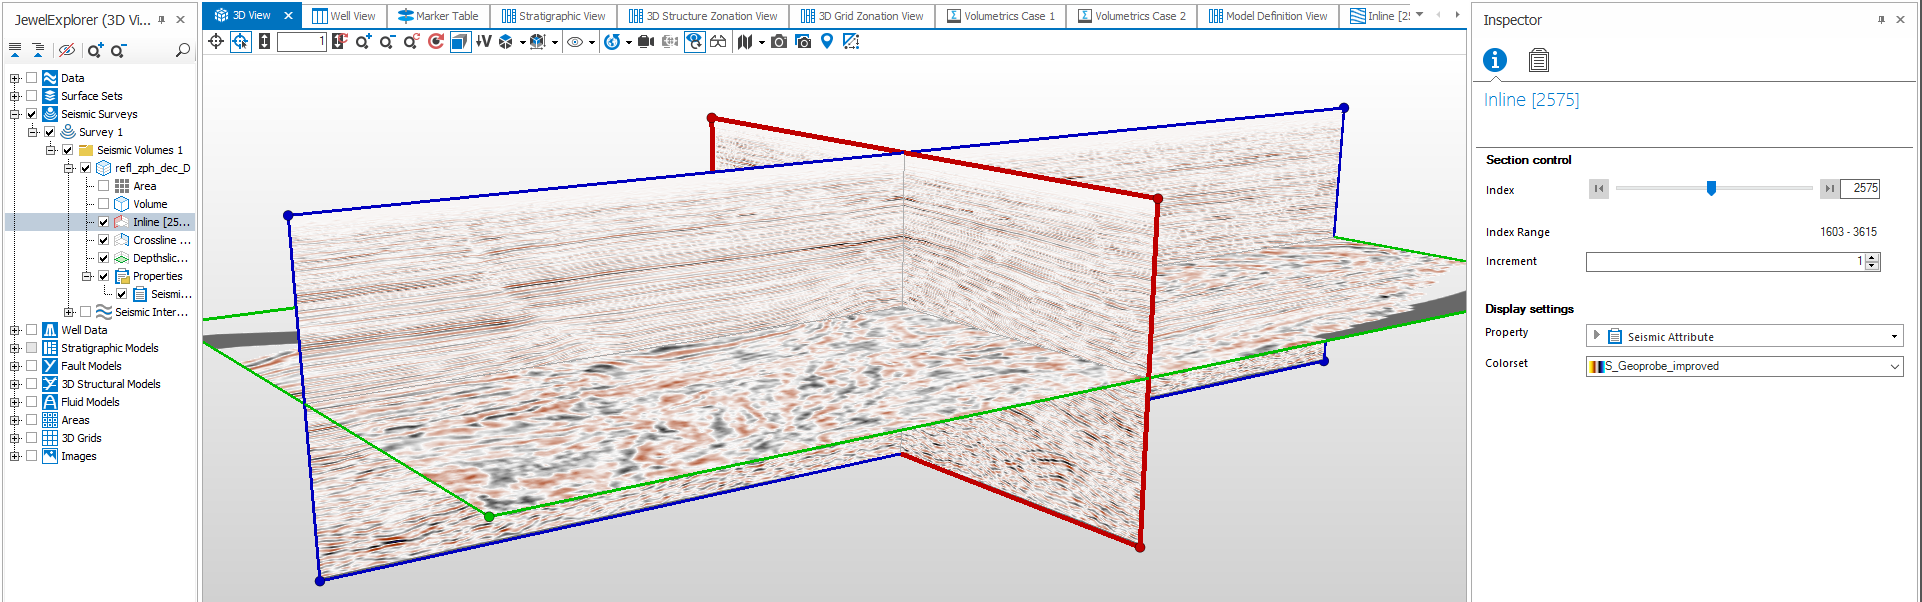
Viewing inline and crossline in a 3D View. Use the buttons in the Inspector to move through slices click to enlarge
To view your seismic data, first display a 3D View and ensure that you check the seismic volume you want to view in the JewelExplorer. Inside this volume, open Properties and select the seismic attribute you want to view. Check the Inline, Crossline and/or Depthslice/Timeslice item in the JewelExplorer, or check the Volume to display the seismic data as a volume. To view the spatial extent of the 3D volume, check the Area check box.
You can also display seismic data on cross sections in the 3D View, see Visualizing your seismic on a random line.
The displayed slices have colored borders (red for inline, blue for crossline and green for depthslice/timeslice). At the corners are small spheres of the same color, which you can use to resize the seismic slices while holding down the Ctrl key.
There are various ways you can move through the slices in any particular direction to inspect the volume in detail:
- Directly in your 3D View, you can hold down the Shift key and drag any of the slices.
- Select a slice in the JewelExplorer. Next, in the Inspector, click the Object Inspector
 icon with your slices displayed in your 3D View. In the Section control section, click on the buttons to move your slices. You can review the index step size for your slider by clicking the Property Inspector
  , under the Slider trackbar section.
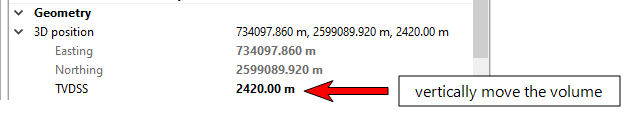
 - Select the overall seismic volume in the JewelExplorer (i.e. the volume at the highest level in the 'Seismic Volume' folder). In the Inspector, click the Object Inspector icon with your slices displayed in your 3D View and you will see a number of sliders. To limit the extent of the slices in the volume, in the Volume section in the Object Inspector, drag the Inline / Crossline / Depth start / end sliders, or type values for the first and last slices in the range you want to view. Click the Reset button to set the ranges to all slices again. Check Lock ranges to fix the ranges of the displayed slices and/or to move a set of inline, crossline and depthslices through the seismic cube without changing the volume size.
- Alternatively, move through the slices by clicking on a slice in the 3D View to select it, then use the forward and back arrows on your keyboard to step through the slices in either direction.
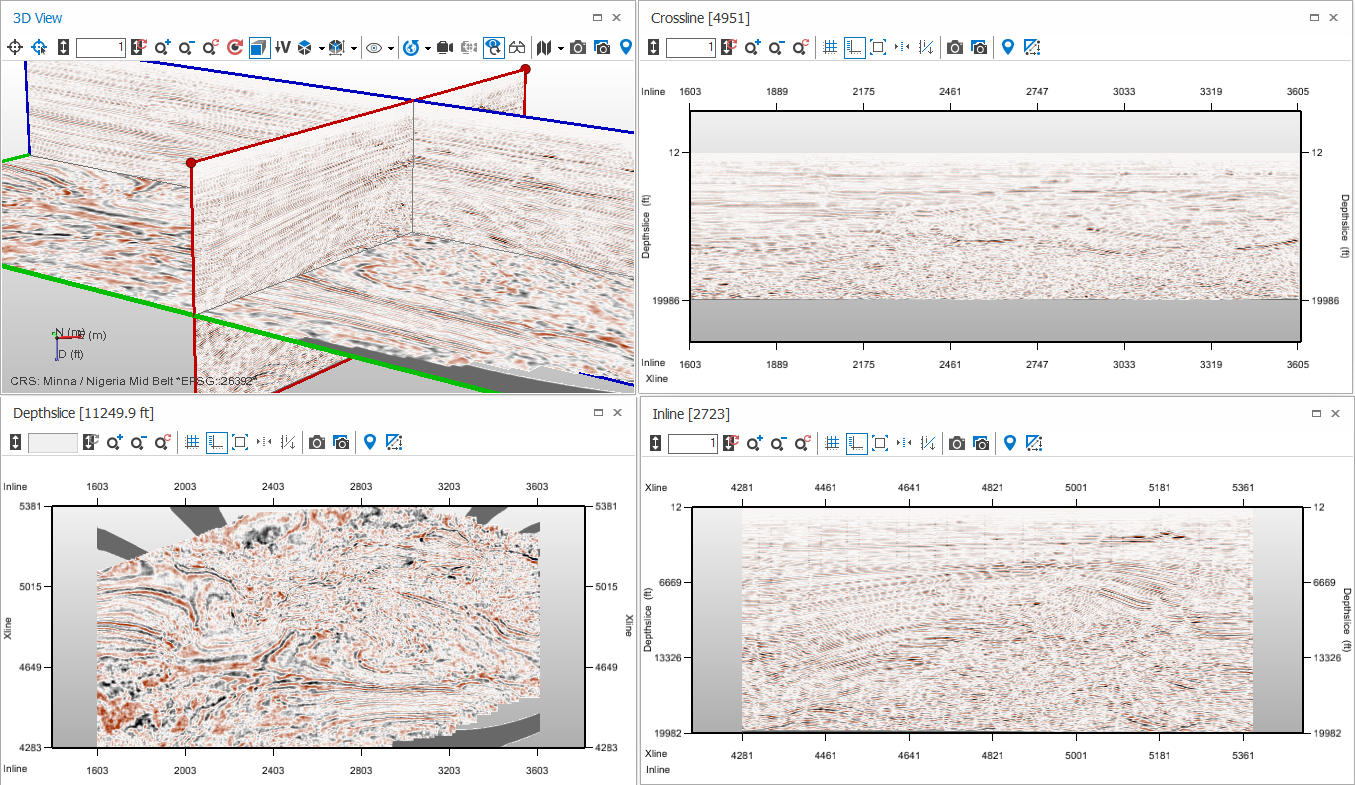
Reviewing seismic data by displaying three Seismic Views and a 3D View simultaneously click to enlarge
For a comprehensive view of your seismic data, you can set up your viewing area to show all three slice views along with a 3D View. Then, when you make changes in slices in any of the views, such as moving a seismic slice, the other views update to reflect this.
View linking options, and especially the cursor linking, can help you better visualize, understand, analyze and compare your data. The cursor linking can be used for 2D views, 3D views, 2D time views, 3D time views, seismic views and a mix of these view types.
Apart from the visibility linking, the seismic views are automatically linked to the 3D view regarding slice movement and ranges.
To set up these four views, display a 3D View, and check, in the JewelExplorer, all three slices (Inline, Crossline and Depthslice). Then open three Seismic Views, and select for each of them a different slice (Inline, Crossline, Depthslice). Then make all the views floating views, either by double clicking on the title bar of the view, or by selecting Float from the context menu of the view Tab, and position the views next to each other as you wish to see them.