Viewing seismic data
A combination of 3D and 2D views can be used to review your seismic data. The 3D View can be used to visualize the voxel grid, while the specialized 2D Seismic View provides functionality to QC and validate data interpretations against a seismic backdrop of any horizontal or vertical orientation. Both views can be opened via the Views button in the top-right corner of the application, or by pressing Alt+F1 for a 3D View, and Alt+F3 for a Seismic View on your keyboard or you can use the Create option of the context menu in the View Explorer. The Seismic View can display 'standard' lines (Inlines, Crosslines or Depth/Time slices) as well as random lines.
Visualizing seismic in the 3D View
Seismic data can be manipulated in the 3D View. You can rotate the seismic volume in 3D, adjust slices in the 3D View, and zoom in on a seismic feature.
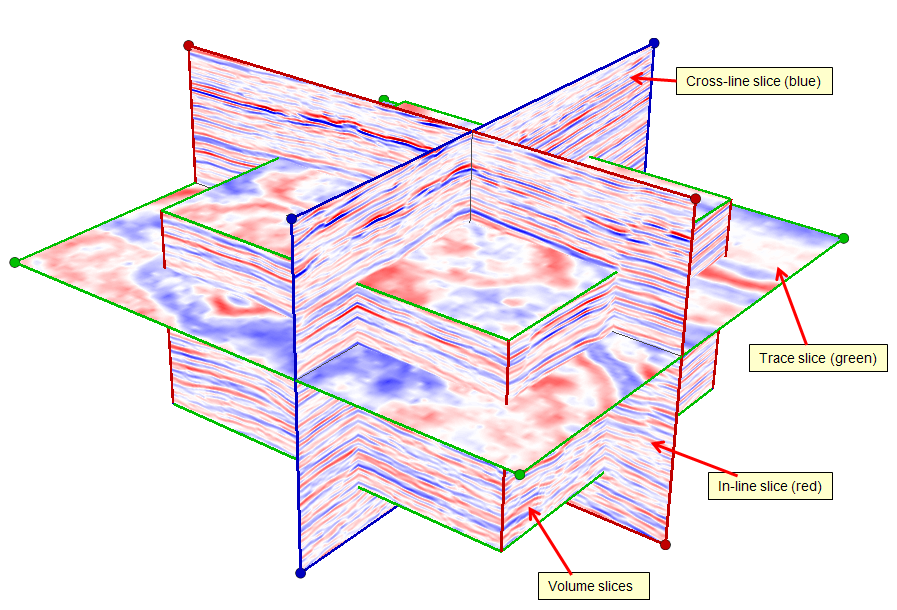
3D seismic click to enlarge
Rotate 3D view Left click and hold to rotate seismic data in the 3D View.
Adjusting slices (directly in the 3D View) All slices of a seismic volume can be adjusted in the 3D View directly:
- Move – Click anywhere on a slice, hold down the Shift key and your left mouse button and drag to move a slice. You can also move through your slices in a 2D View in the same way.
- Resize slice – Select a corner node of a slice, hold down the Ctrl key and your left mouse button and drag to resize a slice. Select the Reset Boundaries option via the context menu of a slice to resize to its original size.
- Resize volume - Select a volume side, hold down the Shift key and your left mouse button and drag to resize a volume.
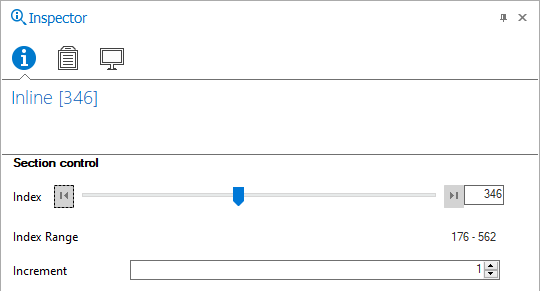
There is a slider for Inline, Crossline and Dephtslice in the Inspector click to enlarge
Adjusting slices (using the Inspector) Move the slider for Inline, Crossline or Depthslice to change the slice position.
Note that the 3D View changes as you move the slider.
Zooming Right mouse click and hold to zoom in and out of the 3D View.
Visualizing seismic in the Seismic View
You can use the dedicated 2D Seismic View to visualize and scroll through Inlines, Crosslines and Depthslices of your seismic volume. To visualize seismic data of a standard seismic line, check the checkbox of an Inline, Crossline or Depthslice/Timeslice, available in your seismic volume in the JewelExplorer. The name of the Seismic View is interactive and will reflect the type and number of the seismic slice that is selected (see image below). By default, the view will display the 'original' seismic attribute, but you can select a different seismic attribute if you have one.
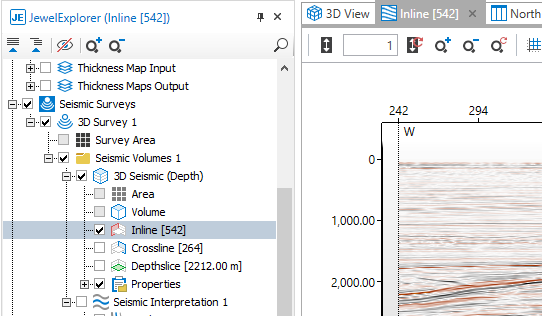
Viewing Inline [2611] in the Seismic View. The name of the Seismic View reflects the selected seismic slice in the JewelExplorer click to enlarge
Apart from standard seismic lines, you can also use a random line to visualize seismic data in the Seismic View. In that case, you need to have an arbitrary cross section available under the Cross Sections folder in the JewelExplorer. For details on visualizing standard and random lines in the Seismic View, see Visualizing your seismic data.