Using Tensor as Display Type
When you select Tensor as shape type on the Shape Graphics form, each node is displayed using 6 arrows, allowing you to visualize (stress) rotations.
The size of the arrow is in indication of the value of each tensor component (major, medium, minor), and the direction of the arrow shows the orientation for each tensor component. For each tensor component, you select a property in the 'Set shape orientation' section on the Shape Graphics form.
When you import the results of a simulation run by Abaqus, or when you are done building a 3D geomechanical model in JewelSuite Geomechanics, you can perform one of the following options to store the tensor properties under a point set for visualization purposes.
Creating a point set from a 3D grid
- Right mouse click on the full volume under the grid in the JewelExplorer to open the context menu.
- From the context menu select Create > Point Set. This will open the Select Properties dialog.
- Select the checkboxes for all the properties you want for the point set.
- Click OK on the dialog.
- A point set with the selected properties is created and stored under the Undefined folder under the Data folder in the JewelExplorer.
Creating point set from a 3D mesh
- Right mouse click on the full volume, on an element set or on a node set under the 3D mesh in the JewelExplorer to open the context menu.
- From the context menu select Create > Point Set when clicking on the full volume or a node set. This will open the Select Properties dialog.
- From the context menu select Create > Point Set Using Element Nodes when clicking on an element set . This will open the Select Properties dialog.
- Select the checkboxes for all the properties you want for the point set.
- Click OK on the dialog.
- A point set with the selected properties is created and stored under the Undefined folder under the Data folder in the JewelExplorer.
Filtering point set data
If a point set consists of many nodes, rendering and performance might become slow. To increase performance you can filter your data in one of the following ways:
- Use the depth property of the point set as a combined filter.
- Use the Property Calculator to create a property for the point set that you can use as a filter. One example could be to use only each 50th node. You can use the following expression: if mod( $Node id$,50)>0 then 0 else 1. Next, use this property as a combined filter to show less nodes.
- Use the Function Tool in combination with the Property Tool to create a property that you can use as a filter.
For more information on how to filter an object based on property values, see Filtering properties.
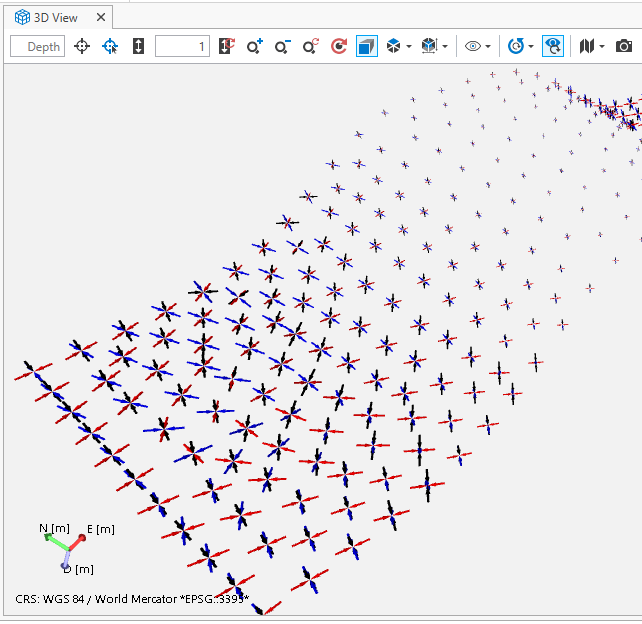
An example where shape type is set to Tensor. You can see a rotation. click to enlarge