Working with trends
With the Trends form you can create multiple trends for a continuous log property displayed in the Well view. You can choose between five different regression types to best fit the log data: linear, exponential, logarithmic, power and polynomial. Each trend is visualized as a trend line in a different color.
You can access the form via the context menu for continuous well logs in the Well View. You can show, hide or delete all the trend lines for the selected well log.
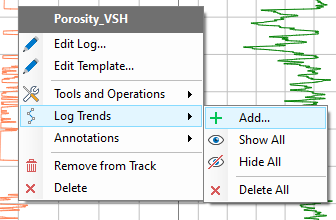
Use the context menu of a continuous well log to add a log trend. click to enlarge
Creating a log trend
- In the Well View, right click on the well log in the track to open the context menu and select Log Trends > Add... to open the trends form.
- On the form, the Well group, Wellbore, Log type and Log fields are already assigned based on the log that you selected in the above step. You can manually change these selections and create trends for other logs.
You can create trend(s) for a continuous log that is currently not visible in the well view.
- In the Trends section on the left side of the form, the trends associated with the selected log are listed. You can add new trend by clicking on Add
 icon or delete an existing trend using the Delete
  icon. Select the trend and assign the associated input settings on the right side of the form.
 - In the Settings section, select the Reference depth, Regression type and the Polynomial order (if applicable). Note that once you have applied the selected settings and generated the trend, you cannot make changes to these inputs settings.
- Reference depth Select between measured depth (MD) or true vertical depth sub-sea (TVDSS) as reference for trend calculation
- Regression Select the type of regression from the drop-down list that you want to use to best fit the log data.
- Polynomial order Except for the polynomial regression, this field is read only. For polynomial equations, enter the order in the field or use the arrows to adjust the order. You can set a maximum polynomial order of 6.
- View the equation for the selected regression type in the Expression field. The coefficients of the equation (a, b, c, etc.) are listed below. The coefficients fields are populated only when you click Apply or OK to generate the trend equation. Once calculated you can edit the coefficient values in the adjacent fields. Use the Reset button
 to revert back to the original values.
 - Check the checkbox adjacent to Update with log if you want to update the trend coefficients when the associated log data is edited or expanded.
- Once you have specified the settings for the trend(s), click Apply or OK to calculate the trend(s) and view them as trend lines in the Well View. The form is updated as follows:
- Name of the trends are updated (not editable) in the Trends section on the form. The default naming convention of the trend(s): <Log>-<Regression (polynomial order if applicable)>-<Reference depth>
- Trend coefficients are calculated and are always displayed in SI units. Click in the coefficient field to view all the digits after the decimal operator and edit the coefficient values if required.
- You cannot change the trend settings anymore.
You can edit your log trends using the graphical tools on the floating palette (Tools > Editing Tools in the Workspace section on the right of the Strip).
Right click on the log trend line in the Well View to access the context menu options.
Hide Hide the selected trend line.
Edit... Opens the Trends form where you can edit the trend coefficients, or add more trends.
Create Log Creates a log based on the trend equation. The generated log is stored under the Logs folder of the wellbore in the JewelExplorer with the same name as trend.
Display Equation in Output Info Displays the trend equation in the Output Info pane which you can copy and use for other tasks.
Reset Reset the coefficient values of the equation to the original values.
Delete Deletes the selected trend.