Template Editor
Editing tracks, logs and log settings for Well View templates are handled with the Template Editor form. You can open the Template Editor via the icon (![]() ) in the Well View toolbar, right-clicking anywhere in the Well View and selecting Edit Template... from the context menu or by double-clicking on a blank part of the Well View canvas.
) in the Well View toolbar, right-clicking anywhere in the Well View and selecting Edit Template... from the context menu or by double-clicking on a blank part of the Well View canvas.
The form has two sections; the track explorer on the left side and the settings pane on the right side. The track explorer is used to add, move, edit and remove tracks from the view. In addition, clicking on a track or log in the track explorer allows you to review and edit its display settings in the settings pane on the right side of the form. The settings pane contains all of the visualization and formatting options available for the selected log or track.
The Track Explorer and the settings pane
Creating a custom template using this form is a step by step process where you can define the number of tracks in the template, the logs that will be displayed in each track, and the display parameters for all of the data; track width, line color, line type, etc.
Track Explorer
The left pane of the Template Editor, the Track Explorer, shows the structure of the active template. This form works in tandem with the JewelExplorer as far as selecting the data that is displayed in your template. For example, if you use the JewelExplorer to display a gamma ray, porosity and resistivity log, these logs will already appear in the Track Explorer of the Template Editor when it is opened.
Within the Track Explorer itself, you can add tracks to the template using the add track button  . The order of the tracks in the template can be defined by using the
 ![]() buttons. For each track in the Track Explorer, you can add logs, 3D grid properties, perforations, well schematics, summation or depth tracks and auxiliary information by right-clicking a track item. The list below describes each of the context menu options in the Track Explorer. Also see a template customization example for a step by step demonstration of creating a simple custom template.
buttons. For each track in the Track Explorer, you can add logs, 3D grid properties, perforations, well schematics, summation or depth tracks and auxiliary information by right-clicking a track item. The list below describes each of the context menu options in the Track Explorer. Also see a template customization example for a step by step demonstration of creating a simple custom template.
Track Explorer context menus
Top item (template item)
Add track Adds a new track to the template. By default, the track is appended to the end of the list, if you want the track to appear in a different position in the structure, use the ![]() buttons to adjust its position. If you want to rename the track, type a new name in the settings pane.
buttons to adjust its position. If you want to rename the track, type a new name in the settings pane.
Track item
Add auxiliary information Adds an auxiliary information track to the template. Use the context menu of the track to add, edit, view or delete the data.
Add compositor Add a track that can contain multiple continuous logs of the same log type (e.g., multiple versions of gamma ray). In the settings pane, you can select the log type and the logs that will serve as input to the composite log. You can also choose to display any associated trend line in order to use it as an input.
Add continuous grid property Add a continuous grid property to the track. In the settings pane you can assign the desired grid and grid property.
Add continuous log Add a track that contains a continuous log. It is important to ensure that you select the appropriate log type for the track (continuous or discrete) to ensure that the correct settings in the settings pane will be available.
Add depth scale For depth tracks, allows you to name the scale and select the depth projection.
Add discrete grid property Add a discrete grid property to the track. In the settings pane you can assign the desired grid and grid property.
Add discrete log Add a track that contains a discrete log. It is important to ensure that you select the appropriate log type for the track (continuous or discrete) to ensure that the correct settings in the settings pane will be available.
Add perforations Add a track that represents the perforations along the wellbore.
Add summation Add a summation to the template. A summation sums the selected (continuous) logs. Use the settings pane to select logs to sum in the summation track.
Add well schematic Adds a well schematic track to the template.
Add image log Adds an image log track to the template.
Remove track Removes the entire track from the template.
Log/Scale/Property item
Remove Removes the log, scale or property item from the track.
Settings pane
Once the structure of your template is defined, you can use the settings pane to specify the various display settings available for each track and log. If you wish to review how your selected display settings affect the data, click the Apply button to update your Well View.
For more details on the Settings pane, see:
Log, scale and property settings
Continuous grid property settings
Clicking the top-most item (the active template) listed in the track explorer displays the General Settings for the template in the settings pane. You can define the following settings at the template level:
General Settings
Background Select between a solid fill and a gradient fill for the background color.
Solid background color When Solid is selected for the Background option, select the color that will fill the entire view.
Gradient background color When Gradient is selected for the Background option, select the gradient color to be applied. The gradient runs from top to bottom.
Marker thickness Select a predefined thickness from the drop-down list for all the displayed markers in the Well View.
Marker names font Select a font to render names of all the displayed markers in the Well View.
Empty tracks Control visibility of empty tracks within the Well View.
Header Visibility
Track names Controls visibility of track names. You can change the track names in the Track settings.
Legends Controls visibility of track legends.
Scale Controls visibility of track scale.
Available track items only Manage visibility of tracks items that are not containing data.
Connection Panels
Wellbore distance Option to define the distance between the wellbore tracks in the view. The default measurement is pixels (px), however, you can right-click the px designation and choose from centimeters, inches, millimeters or points.
Marker names Choose whether the marker name should be displayed along the marker in the view between the different wellbores that contain the similar markers.
Generic Depth Scale
During the template creation process you can choose to add a generic scale to the view. Generic scales are always visible in the view and move with the view when you scroll horizontally. You can choose a location for the generic depth scale in the Well View with the Position option. When selecting a generic depth scale, you can select the primary depth scale using the drop-down list in the Measure section of the Well View toolbar.
Position Only active when a generic depth scale is displayed. The selection here will dictate where in the view the generic scale will appear.
Background color Only active when a generic depth scale is displayed. This selection controls the background color of the generic depth scale track.
When you click a track item in the track explorer, the settings related to the track display appear in the Settings pane.
Display name A name for the track can be given in this field. The active track item will also take the name given here.
Width The display width of the track. The default measurement is pixels (px), however, you can right-click the px designation and choose from centimeters, inches, millimeters or points.
Background Color The background color that will be applied to the active track.
Gridlines Controls the visibility of gridlines for the selected track.
Grid color If gridlines are turned on you can select their color.
Legend font Font which will be used to display item names in the track header.
Scale font Font which will be used to display scale elements (ticks values) in the track header.
Unit font Font which will be used to display unit label in the track header.
Group log scale Displays the headers in a group Per Log Type . or Per Quantity and not grouping the headers when selecting Off.
Legend Defines what type of legend will be used for grouped logs: legend per log or one legend for log group.
Marker names Controls the visibility of marker names for the selected track.
Align Controls the positioning of the marker names within the selected track.
Curve filling settings
The curve filling settings allow you to customize a fill color and behavior for the logs in a track. You can create fill settings, for example, that fill between track edge and curve, between two curves or between a curve and a value. You can create as many fill settings as desired; these settings can then be managed by arranging the order in which they are applied and by indicating which settings are active.
A toolbar is available for managing your settings, including adding, deleting, and changing the order of the settings:
|
|
Texture Catalog Opens the Texture Catalog where you can add and delete your own textures. |

|
Add Adds a new fill setting to the track. See the Fill Settings table below for details on creating a fill setting for your template. |

|
Order Changes the order in which the settings are applied to the track. To change the position of a specific setting in the order, click the setting to make it active (the setting item will turn blue), then click the up or down arrow to change its position. |

|
Delete Deletes the selected setting. To delete a setting, click the setting to make it active (the setting item will turn blue), then click the delete icon. |
Fill settings
When you add a setting to the list with the add button in the toolbar, a new, blank setting appears. Here you can specify the fill behavior that will be applied to the curves in the track. The following options are available for each setting:
 The assigned order of the setting, this information is read-only. If you wish to adjust the order that the setting is applied, use the arrow buttons as described in the Curve Filling Settings table above.
 Indicates whether or not the setting is active; checked boxes indicate active settings.
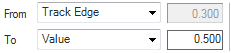
Define the fill behavior. There are a few combinations you can define between the available fill types: Track Edge, Property, Value and Mean.
Selecting Value activates the adjacent text boxes, where you can specify a value.
Selecting Mean will shade the curves from a mean value to the track edge, another mean or log. For normal logs, the arithmetic mean is used. For logarithmic displayed logs, the geometric mean is used.
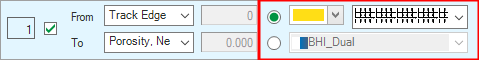
On the right side of the setting, you can select either a solid color or a colorset to use for the fill setting. For a solid color, you can use the color only, or use the combination of color and texture. In that scenario, select a texture from the texture drop-down list. When the selected texture is non transparent, you only see the texture.
Log, scale and property settings
When you click a scale, log or property item in the track explorer, the related display settings appear in the settings pane.
Scale settings
Scale Specifies the scale that is assigned to the track.
Display name A name for the scale track can be given in this field. The active scale item will also take the name given here. Note that a change in the Display scale selection will overwrite the name given in this field.
Compositor Settings (see also Graphically creating composite logs in the Well View)
Log type Select the log type for which you want to create a composite log from the drop-down list. The top part of the list shows the log types present in your solution. The bottom part, below the divider, shows all the possible log types for which you can create a composite log, but they are not present in your solution yet. Upon selection, the Logs table below is populated with all the logs of the selected log type that exist in your solution.
Display name This is the name given to the track for display purposes. This name is displayed in the legend of the track in the Well View. The default name is 'Compositor' but once you select a log type, it updates to 'Compositor <name of log type>' to indicate your selection.
Logs Based on the log type selected, a list of logs present in your solution shows in the table. Select the log you want as input for your composite log and click on the blue arrow button to move it to the Input Logs table.
Input logs Shows the list of logs that you selected to serve as input to your composite log. These logs will be displayed in the compositor track in the Well View.
Display name (read-only) This is the name of the log that will be displayed in the legend of the track in the Well View.
Color This is the default color of the selected log type as it is defined in the Property Catalog (HOME > Settings). You can change the color of individual logs by clicking on the drop-down arrow and selecting a different color from the color palette. The color change only applies to the compositor track and it does not change the default color of the log.
A toolbar is available for managing your selection, including deleting and changing the order of the input logs:
|
|
Move the selected log one step up in the Input logs table. |
|
|
Move the selected log one step down in the Input logs table. |

|
Remove the selected log from the Input logs table. |
Trendlines Controls whether the log trends are displayed in the compositor track (On) or not (Off). By displaying a trend line in the compositor track, you can select it as input to your composite log with the Create Composite Log tool.
Annotations Controls whether the log annotations are displayed in the compositor track (On) or not (Off).
Scale
Type For the selected logs, choose whether to display them using a linear or logarithmic scale.
Manual You can specify minimum and maximum display values for the scale. If the Global Display checkbox is checked for the selected log type in the Property Catalog (HOME > Settings), then the default min/max display values for the scale correspond to the Global Display Min/Max values. If not, then the default min/max display values for the scale correspond to the lowest and highest log value that exist amongst all the logs of the selected log type.
Automatic Determines the appropriate minimum and maximum values for the scale, based on the wells that are currently displayed in the Well View. You can choose whether the same scale should be applied to all wells or on a well-by-well basis.
Number font You can change the font style and size of the scale that is displayed in the legend of the track in the Well View. Click on the ellipsis button  to open the Font dialog and select a font style and size of your preference. Click OK to save your settings and close the dialog.
Continuous log settings
Continuous Log
Log type Select the log type to be displayed.
Log Based on the log type selected, a list of logs in your solution that you can display is available in the drop-down list. Select the log you want to display.
Display name This is the name given to the log for display purposes. This name is displayed in the legend of the track in the Well View.
Trendlines Controls whether the log trends are displayed in the track (On) or not (Off).
Annotations Controls whether the log annotations are displayed in the track (On) or not (Off).
Scale
Type For the selected log, choose whether to display it using a linear or logarithmic scale.
Reverse direction Controls whether the scale is displayed left-to-right (Off) or right-to-left (On).
Tick mark increment Defines an interval for rendering tick marks.
Manual (scale values) You can specify minimum and maximum display values for the scale.
Automatic (scale values) While the Automatic option will determine the appropriate minimum and maximum values for the scale, you can select the display range, add margins to either side of the track and choose whether the same scale should be applied to all wells or on a well-by-well basis.
Range Select the scale range that you want displayed in the track. For example, selecting the P25-P75 option reduces the displayed scale range so that only the range falling within the middle 50% of the scale is displayed; the scale values falling within the minimum 25% and maximum 25% are cut out of the view. Applying this option to a scale with values ranging from 0 to 10 will only display the data falling within 2.5 and 7.5 on the scale. By default, the option P10-P90 is selected.
Left margin Allows you to add a buffer to the left side of the track in order to capture data that may fall out of the scale.
Right margin Allows you to add a buffer to the right side of the track in order to capture data that may fall out of the scale.
Auto scale Choose between applying the automatic scale to all wells or on a well-by-well basis. If Per Well is selected, the optimum values for each well will be determined, resulting in different min/max values for a curve on each well.
Display
Interpolation Choose between a linear (Line) or step (Stairs) interpolation.
Color Applies a color of your choice to the log. But default uses the color of the log object.
(Line) Style Select a line style from the drop-down list.
(Line) Thickness Defines the line width for the log.
(Point) Style Choose between a number of different options to use for data points from the drop-down list.
(Point) Size Select the size of the points.
Discrete log settings
Log Settings
Log type Select the log type to be displayed.
Log Based on the log type selected, a list of logs in your solution that you can display is available in the drop-down list. Select the log you want to display.
Display name This is the name given to the log for display purposes. This name is displayed in the legend of the track in the Well View.
Annotations Controls whether log annotations are displayed in the track (On) or not (Off).
Display
Property class names Controls whether property class names are displayed in the track (On) or not (Off).
Fill This option allows you to render a discrete log in one of three ways:
Block Fill Each class fills the track width from edge to edge. Filling will use the color specified for the corresponded class from the table below. If texture is specified, both color and texture will be used for filling.
Curve Fill Each class fills the track based on the class indicator in the track legend.
Line Only Removes the fill and displays only a line representing the log data.
Continuous grid property settings
Continuous Grid Property
Grid Select the 3D grid from which the property will be selected.
Property Select the 3D grid property to display.
Display name The name given to the 3D grid property item in the Templates form; this name is not displayed outside the Template Builder.
Header Visibility
Property name only The name of the track that contains the 3D grid property will take either only the name of the property, or will display the entire property name, which contains the full path to the property. When On is selected, only the property name is displayed.
Scale
Type For the selected log, choose whether to display it using a linear or logarithmic scale.
Reverse direction Controls whether the scale is displayed left-to-right (Off) or right-to-left (On).
Minimum Specify the minimum value of the scale for the property.
Maximum Specify the maximum value of the scale for the property.
Display
Cell boundary Check this box to visualize the cell boundaries.
Interpolation Choose between a linear (Linear) or step (Stairstep) display.
Color Applies a color of your choice to the log.
(Line) Style Select a line style from the drop-down list.
(Line) Thickness Defines the line width for the log.
(Point) Style Choose between a number of different options to use for data points from the drop-down list.
(Point) Size Select the size of the points.
Discrete grid property settings
Property Settings
Grid Select the 3D grid from which the property will be selected.
Property Select the 3D grid property to display.
Display name The name given to the 3D grid property item in the Templates form; this name is not displayed outside the Template Builder.
Header Visibility
Property name only The name of the track that contains the 3D grid property will take either only the name of the property, or will display the entire property name, which contains the full path to the property. When On is selected, only the property name is displayed.
Cell boundary Check this box to visualize the cell boundaries.
Property class names Controls whether property class names are displayed in the track (On) or not (Off).
Fill This option allows you to render a discrete log in one of three ways:
Block Fill Each class fills the track width from edge to edge.
Curve Fill Each class fills the track based on the class indicator in the track legend.
Line Only Removes the fill and displays only a line representing the log data.
Perforations
Perforation
Perforation name The name given to the perforation track.
Display
Alignment Select on which side of the track the perforations are displayed.
Fill The perforation representations can be rendered as filled Block for better viewing or as Line Only. In case of Block option, filling will use the color specified for the corresponded perforation from the table below. If texture is specified, both color and texture will be used for filling.
Well schematic
Well Schematic
Scale
Mirror scale Controls whether the wellbore diameter (On) or the wellbore radius (Off) is used for the well schematic scale in the Well View.
Manual (scale values) You can specify minimum and maximum display values for the scale.
Automatic (scale values) While the Automatic option will determine the appropriate minimum and maximum values for the scale, you can select the display range, add margins to either side of the track and choose whether the same scale should be applied to all wells or on a well-by-well basis.
Display
Hole size Displays a black line in the track to show the hole outline when On is selected. Select Off to hide the hole outline.
Annulus fill Fills the annulus with a blue color and the hole with a gray color when On is selected. Select Off to hide all filling colors.
Perforations Displays the perforations as short sticks in the schematic track when On is selected. Select Off to hide the perforations in the well schematic track.
Perforation color Select a color to display the perforations (if toggled on) in the well schematic track.
Caliper log Controls whether the caliper log is displayed in the Well View (On) or not (Off). The caliper log is displayed together with the casing scheme in the same track, in the Well View and its scale is automatically adjusted to be the same as the scale of the well schematic. The maximum scale is adjusted to use the highest value between the two data types.
Log A list of caliper logs is available in the drop-down list. Select the log you want to display together with the well schematic in the Well View.
Position Only active when mirror scale is On. The selection here dictates where in the track the caliper log will appear.
Annotations Controls whether log annotations are displayed in the Well View (On) or not (Off).
Well Event
Name The name given to the well event track.
Well Event Subcategories
Displays the categories and its well event types. Select the categories or well event types to be displayed in the track.
Opacity Controls the opacity of the well event symbols in the track. By default, the value is 100%.
Size Specify the size of well event symbol to be displayed in the track. By default, the value is 100%.
Align to Mud Weight Select to align the horizontal position of the well event in the track based on its Mud Weight (MW) or Equivalent Mud Weight (EMW) value. You can specify the minimum and maximum display values for the horizontal scale by typing a value in the Minimum and Maximum entry fields. The scale will be displayed in the legend of the track in the Well View. The default display min/max values of the horizontal scale can correspond to:
- the Global Display values defined on the Property Catalog form for the MW/EMW property. This happens when the Global Display checkbox of the two properties is selected on the Property Catalog form.
- the lowest and highest MW or EMW values that exist among all the well events present in your solution. These are the values you specified upon creation of the well event, on the Create Well Event form. To use the specified values, you need first to uncheck the Global Display checkbox of the MW or EMW (HOME > Settings > Property Catalog).
Align to Select to align the well event symbols on the Left, Center, or Right side of the track.
Label Select the display label type. Select None to hide the well event name, Name to display the well event name, or choose Type to display well event type in the track.
Label font Specify the font of well event label to be displayed in the track.
Image Log
Log type Select the log type to be displayed.
Log Based on the log type selected, a list of logs in your solution that you can display is available in the drop-down list. Select the log you want to display.
Display name This is the name given to the log for display purposes. This name is displayed in the legend of the track in the Well View.
Display Range
Minimum Specify the minimum value of the scale for the colorset.
MaximumSpecify the maximum value of the scale for the colorset.
Colorset This is the colorset that is used to color all the values of the image log.
Summation
Summation
Name Name of the summation track.
Quantity Select a physical quantity from the drop-down list to act as a filter for log type and log selection.
Log type Select a log type from the drop-down list to act a filter for log selection.
Logs Select the logs you want to display in the summation track.
Displayed logs Lists the currently selected logs that will be displayed in the summation track. You can change the color of the logs, or select to display logs with textures. For more information, see Displaying textures in the Well View.
Normalize to 1 Check to normalize the sum of the selected logs to 1. That also will change units used for the track scale from units of selected physical quantity to Ratio units.
Log
Log name Lists the name of the currently selected log.
Line
Type Choose between a linear (Line) or step (Stairs) display.
The following description depicts a simple process for customizing a template using the Template Editor.
- With an empty Well View open, check the boxes for a number of wells and logs in the JewelExplorer so that they are visualized in the view.
- Click the Save button
 in the Well View toolbar and provide a name for the template. Now, if you continue to make changes to the template via the JewelExplorer, all the changes can be saved under your new template name. As long as there are no new changes applied to the template, the Save button turns gray
  .
. - To change the display settings or add more tracks and logs to the template, open the Template Editor via the Edit template button
 , right-clicking anywhere in the Well View and selecting Edit Template... from the context menu or by double-clicking anywhere in the Well View. In the Track Explorer, you can see that the wells and logs you selected in step 1 are already represented in the structure.
 -
The top item in the track explorer has the same name as you gave the template, this is the template item and it controls the general settings of the template. Click this item and review the General Settings in the settings pane. Change the Background color setting to a light gray color and click Apply. The background of the entire Well View changes to match the color you selected.
As you continue working with the Template Editor, click Apply each time you want to submit your template change and update the Well View. Additionally, the save icon in the Well View toolbar now appears in blue, indicating that the template has unsaved changes. For now, don't worry about saving the template, as there are still changes to be made.
- Add another track to the template. Instead of using the JewelExplorer to add the track, however, you will use the Track Explorer. Right-click the template item and select Add track. This will add a New Track item under the main item.
- Click the New Track item and rename it to Depth in the settings pane.
- Right-click the Depth item and click Add depth scale. A Depth Track item is now available under Depth.
- Click the Depth Track item and select TVDSS in the Display scale drop-down list. The item also takes the name TVDSS. Click Apply to see your changes: a TVDSS depth track is added to each of the wells in your view.
- Next, you will add a track that contains only a gamma ray log (if your data does not contain a gamma ray log, substitute with any other log that's not already present in your template). In the track explorer, right-click the main item and select Add Track. A New Track item is added under the main item.
- Click the New Track item and provide a name for the track. Since this track will be populated with gamma ray data, name the track Gamma Ray.
- Right-click the Gamma Ray item in the track explorer and select Add continuous log. This will add a Continuous item under the Gamma Ray track.
- Click the Continuous item. Rename the log to GR and select Gamma Ray in the Log type drop down box.
- In the settings pane, scroll down to the Line Settings options and ensure that the Color is set to green. Click Apply to add the gamma ray track to the Well View.
- With the gamma ray log added, your template is complete. Click OK to close the Template Editor. In the Well View toolbar, click to save the changes to your template. A dialog appears asking if you want to update the current template or create a new one. Click Update.
- Lastly, open the Template drop-down list, or open the Template Manager
 . You can see in the Template Manager that your template is added to the list. If you wish to rename, export or delete your template, click on the template and then click the button for the desired action.