Dependencies Analyzer
Using the Dependencies Analyzer in the Tools button group (Concept > Concepts > Tools), you can view the input dependencies of the domain models that define the saturation model assigned to the selected concept. On the form, the models are listed in the order of execution. The saturation model and net-to-gross model are included as well.
You can view the relationship between domain models and input dependencies in a table, a matrix or a graph format. The form also allows you to simultaneously compare the dependency table, matrix or graph with another volumetric concept. You can export the results to a spreadsheet for further analysis. With the filter and search functionality, you can perform a quick search, or create custom expressions to filter the results on model name, model type and input dependencies.
Working with the dependency table/matrix/graph
- On the form, select the Scenario from the drop-down list. The related concepts are filtered in the next selection.
- Select the Concept you want to show the dependencies for from the drop-down list.
- Optionally, click on the adjacent Compare button
 to open a second instance of the form and show the dependencies for a different concept at the same time. You can open only one additional instance of the Dependencies Analyzer form along with the primary form that is active. The Compare button on the primary form is deactivated once you open the second instance of the tool.
 - Use the XLS button
 to instantly open, and export, the dependency table in an Excel™ spreadsheet (the file will have two sheets: one for the table and one for the matrix format). If you have a second instance of the Dependencies Analyzer form open, then that spreadsheet must be exported using the XLS button on that form. The Excel™ file is saved in the folder location of the solution and has a default naming convention: Dependency Table_<Volumetric Scenario>_<Concept>.xls
- By default, the domain models and their input dependencies are displayed in the Table format. Click on the Table, Matrix or Graph buttons to switch between the display format of the dependencies.
The Table format of the Dependencies Analyzer lists the domain models, in the order of execution, that lead to the generation of the root saturation model assigned to the concept in the Assign Models step. The column headers in the table show the information about the associated domain models and their respective input dependencies.
- Row and Order The first column represents the intermediate steps and related input dependency model or property. The second column displays the execution order of the domain models. For some domain models, multiple inputs may be needed and so the respective rows are grouped.
- Model Name, Model Type, Root and Concept Input columns These columns provide the information on domain models (i.e. model name, model type) along with the root saturation model, and the concept input definition models (NTG and saturation) that you assigned on the Assign Models form. In the Root column, the model is shown with the letter 'R' while the Concept Input column is displayed with letter 'I'.
- Input dependencies The last two columns in the table show the inputs used for building the domain models along with their respective model or property type. If the input used for creating a domain model is also another domain model from the same concept, then it is shown in bold text. The inputs displayed in normal text are exclusively used for that domain model and do not have input dependencies for any other model in the selected concept.
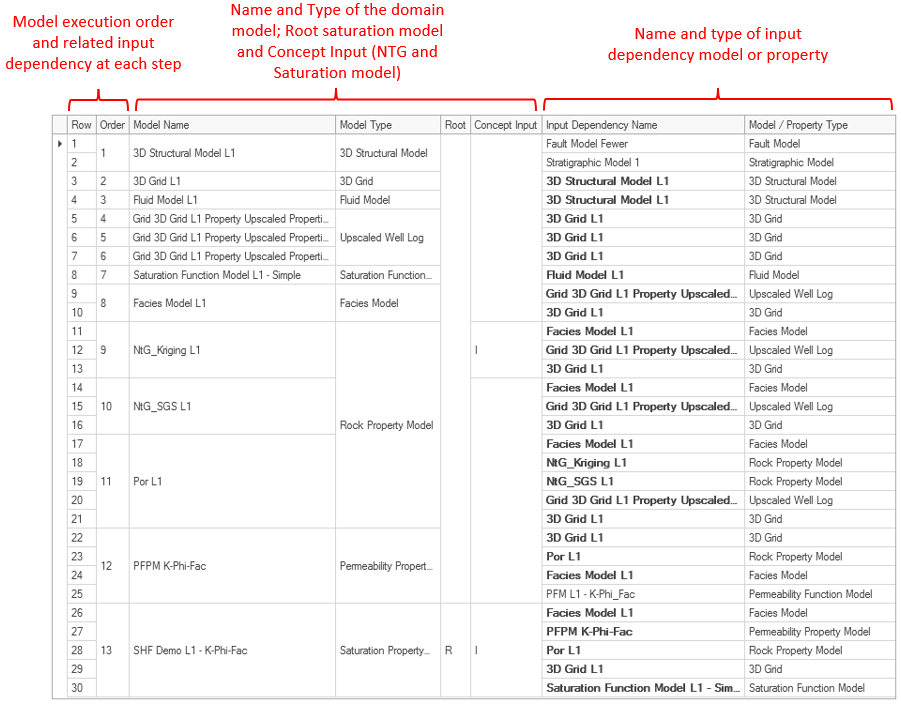
Abstract example of the dependencies for a volumetric concept displayed in 'Table' format. Each horizontal row is a modeling step in the concept. The domain model names are shown in the third column. The last two columns display the inputs used for creating the domain models. click to enlarge
In the Matrix format, the dependency table is displayed with the input dependencies listed along the columns while each row represents a domain model. You can sort the input dependencies in the columns in Execution Order (default) or in Alphabetical Order.
- Domain models (rows) The domain models related to the volumetric concept are listed in the ascending order of execution similar to the Table format. Click on the column header to change to the descending order.
- Input dependencies (columns) The input dependencies listed in the columns are arranged in the execution order by default. Click on Execution Order or Alphabetical Order buttons to change the sorting of columns. The dependency columns can be categorized in two parts - Domain models and Input properties. When viewed in the order of execution, the input dependencies from domain models are placed in the starting columns and can be referred in the 'Table' format with bold formatting. The input properties (or models), which are exclusive inputs to specific domain models, are placed after the domain model columns and can be referred in the 'Table' format with normal formatting.
- Matrix (cells) The matrix cells are populated with numbers which represent the intermediate modeling step of the concept workflow, for the corresponding input dependency and domain model. You can refer to this number with the 'Row' number in the Table format.
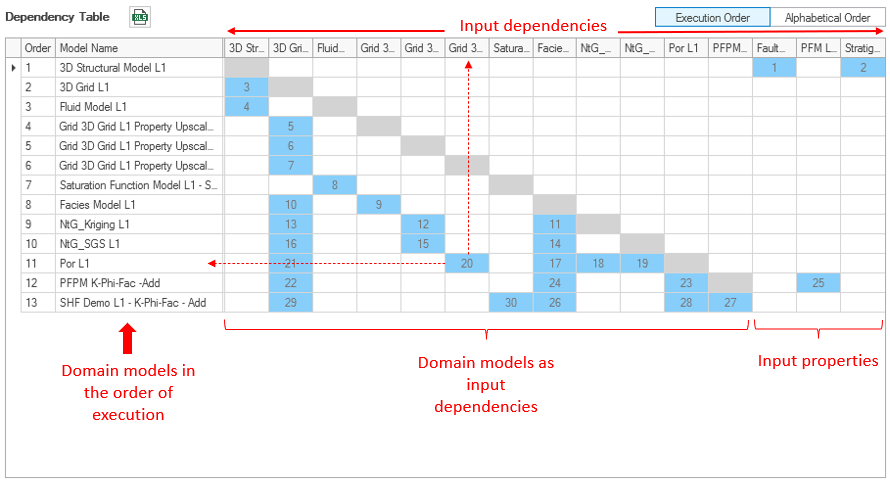
Abstract example of dependencies for a volumetric concept displayed in 'Matrix' format. Each horizontal row is a domain model in the selected concept. The columns represent the input dependencies used for creating the domain models. The input properties that are used exclusively to create the domain models, and not used in any other modeling step, are shown in the end columns (Input properties). click to enlarge
The graph format shows the domain models, in the order of execution from top to bottom, that lead to the generation of the root saturation model assigned to the concept in the Assign Models step. With the graph format, you can easily see direct dependencies. A default filter is applied, so that upon opening only the most important models that are associated with the selected concept are shown. For each model, the model name, the model type and the order of execution are listed.
To interact with the graph, use mouse controls and the options on the right side of the graph.
Filters
Click on the filter icon to show  or hide
  the filter section. By default, only the most important models that are associated with the selected concept are displayed in the graph upon opening. All model types that are present in the concept are available for selection, model types that do not exist in the selected concept are disabled (grayed out). One exception is the property option, which includes properties that are created for a model, but are not the result of a (model) workflow, e.g. VOIs. After closing the Dependencies Analyzer tool, changed settings are reset to the default option.
Graph Settings
Rebuild graph - If the checkbox is checked, any interaction you do with the graph is updated immediately. If you have many models this can take a long time, and in that case it is advised to uncheck this option. If the checkbox is unchecked, changing the settings will only hide or unhide models in the graph if the selected model types were already selected for display in the graph. Checking an extra model type in the filter section that was not already selected when the checkbox was unchecked, will not be shown.
Hide common parent connections - This option is checked by default, only the longest 'chain' of connections between two models is shown. All direct arrows are hidden, unless this is the only connection between models. If this option is unchecked, all connections between models are shown in the graph.
Levels - The number you enter here, determines how many 'levels' of dependents or precedents show their relationship with the model you select in the graph (the arrows have a filled arrow head).
Dependents - If selected, the arrows with a filled arrow head go from the selected model to models that use that model as input.
Precedents - If selected, the arrows with a filled arrow head go from the input model(s) to the selected model.
Mouse controls
- CTRL key plus mouse wheel to zoom in and out.
- Double click in the gray title bar of the form to expand the form to the size of your screen.
- Left or right mouse click on a model to select it, it is highlighted in gray.
- CTRL + left or right mouse click to multiselect models (selected models are highlighted in dark blue).
- Left or right mouse click and drag to activate a rectangle to multiselect models (selected models are highlighted in dark blue).
- Left or right mouse click and drag a selected model or selected models to a new location in the graph.
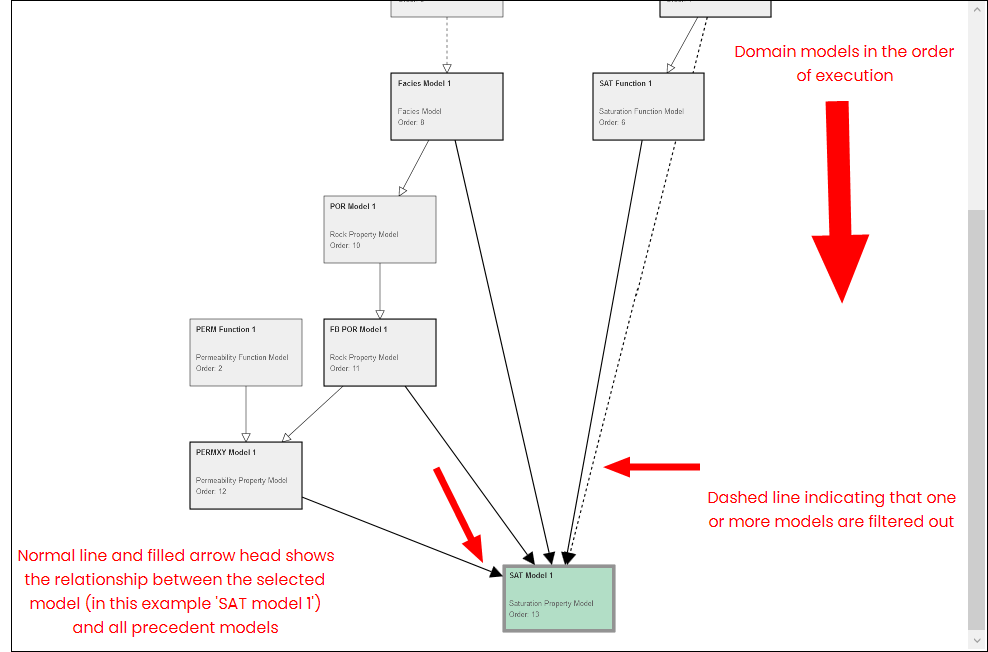
Abstract example of dependencies of a volumetric concept displayed in 'Graph' format. click to enlarge
Graph legend
|
|
Arrow indicating that there is a direct dependency between the two models. |
|
|
Arrow that shows the relationship from the selected model to all dependent or precedent models (adhering to the graph settings), always pointing in the order of execution. The dependent or precedent models are highlighted in dark gray. |
|
|
Arrow indicating that with the current settings there is a model in between the two models that is filtered out. |
|
|
Arrow indicating that with the current settings there is a model in between the two models that is filtered out. It also shows the relationship from the selected model to all dependent or precedent models (adhering to the graph settings), pointing in the order of execution. The dependent or precedent models are highlighted in dark gray, |

|
Input model for the concept, selected on the Assign Models form. |

|
Property Calculator model that is selected for duplication. |

|
Function Property Model that is selected for duplication. |

|
Model that is selected for duplication. |

|
Indicates that this model has uncertain parameters. Hover over the model to show a tool-tip with more details. |
Filtering and searching data in the dependency table
Volumetric concepts can consist of a large number of domain models, and have their related input properties and co-dependencies with other model inputs. This can make the information in the dependency table very complex to apprehend. With the filtering and search functions on the form, you can view only the relevant information on the form.
Click anywhere in the table and use CTRL+F to open the search panel on the form, or use the context menu of column headers and select Show Search Panel to display the search panel at the top of the dependency table or matrix. After you enter the term in the search panel, the results are immediately filtered and shown in the table below. With the Filter Editor dialog, you can create custom search function expressions with multiple conditions and filters.
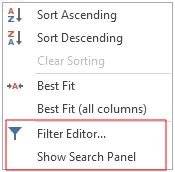
The context menu of the column headers has the options to open the Filter Editor dialog and to open the Search Panel to filter information in the dependency table. click to enlarge
The Filter Editor dialog can be accessed from the context menu of column headers in the Table format only. On the dialog, you can create multiple conditions of filters with respect to model name, model type, input dependency name and model/property type. You can assign Boolean operators between conditions, or create a group condition, or create a custom expression for filtering.
- On the dialog, use the buttons at the top to change the boolean operator or add a condition.
- Operators Select between 'And, Or, Not And, Not Or' operators to define the operating logic in conditions.
- Add condition Click on the button
 to add a condition. As you add more than one condition filter, the new condition is shown at the top.
 - Change condition type Use the drop down arrow to change the condition type. With 'Add Condition', you add one condition specific to model attributes. With the 'Add Group', create multiple layers of conditions in a group (e.g., filter rock property models, upscaled well logs). With the 'Add Custom Expression', an entry field is shown which opens the Expression Editor dialog where you can create custom expression using logical and math operators.
- At the condition level, there are three fields that you must enter. In the first field, select the attribute for the domain model or the input dependencies.
The related objects are filtered accordingly as you define the condition.
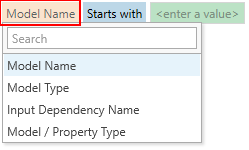
Select the domain model or input dependency attribute. click to enlarge
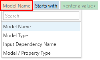
- Next, select the logical operators from the drop down list. The default selection is 'Starts with'.
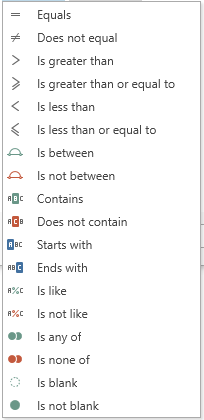

Select the logical operator from the drop-down. click to enlarge
- In the last field, you enter the value which will be used as filter keyword in combination with the logical operators. You can also use the drop-down arrow to select the objects which were filtered based on your selection in step 2. For example, if you select 'Model Type' in step 2 then the drop down options will list the domain model types in the concept. You can sort the list based on Value (alphabetical)or Quantity.
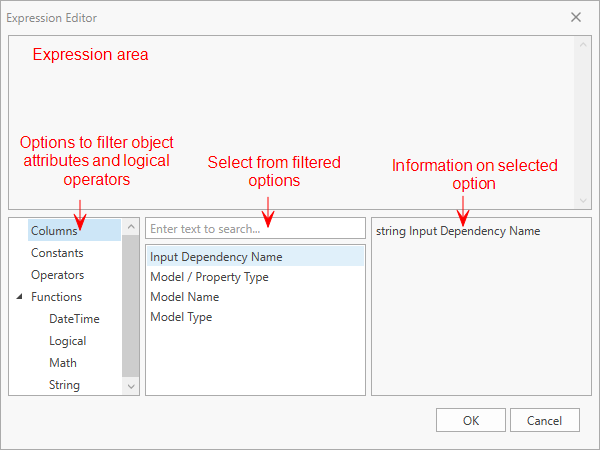
- If you are using a custom expression to define the filter condition, click on the field with Enter an expression... to open the Expression Editor dialog. Use the various options, as shown in the image, to create an expression. Click OK to save the expression and close the dialog.

Select the logical operator from the drop-down. click to enlarge
- To delete a condition, hover the mouse at the end of the expression and click on the delete
 icon.
icon. - Once you defined the filtering conditions, click Apply or OK to display the filtered data in the dependency table at once.