Property context menu
Hide (Only for context menu in a view) Hide it in your view.
Show Legend Show or hide a legend for it in your 3D View.
Image (Only for image logs) Change the display smoothing for image logs
( ) in 3D View.
Smoothed (Static) Displays a smooth image for the entire image log data (default).
Smoothed (Dynamic) Displays a smooth image for the selected dynamic range. Adjust the Dynamic Window Size in the Property Inspector > Display Parameters.
Unsmoothed Displays the raw image log data.
Display Settings (Only for logs)
Color Pick a color to display it in the view.
Transparency Make it semi-transparent. Adjust the opacity value from the Property Inspector.
Fill Type Set the fill type to No Fill (only the curve is shown), Property Colors (the fill uses property colors, to indicate log values) or Object Colors (the fill uses the color of the log curve object).
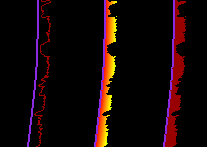
Left to right: No Fill, Property Colors and Object Colors click to enlarge
Fill Direction Set the fill direction of the log curves: Fill to min, Fill to max, Fill to zero, or Column. Fill to zero is useful for filling either the positive or negative values for logs with both positive and negative values, such as residual logs.
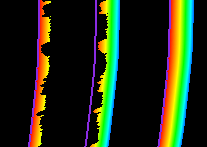
From left to right: Fill to min, Fill to max, Column click to enlarge
Fill Interpolation Style Set the fill interpolation style to horizontal or vertical.
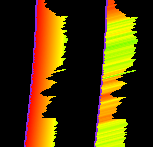
Vertical (left) and horizontal click to enlarge
3D Log Display the log in either 1D or 3D. When your wellbore is highly deviated, the 3D display in the transition zone between the vertical and horizontal part of the wellbore is only properly handled when the 3D log threshold angle is set to 0 degrees. The default value for the threshold angle, after importing the logs to the solution, is 5 degrees. You can change this angle in the Property Inspector, having the Wells folder selected in the JewelExplorer.
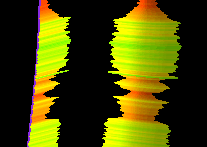
1D (left) and 3D click to enlarge
Show Shape (Only for image logs) Display the shape of the image log in the 3D. The shape is rendered using the raw log data and the image smoothing options are disabled.
Show Mesh (Only for logs) Active only while displaying the log in 3D. Display the mesh boundaries at measured depths and for multiple (radial) sectors.
Multiple Log Views Arrange multiple logs to be displayed separately.
Use as Combined Filter (Only for properties of a 3D grid, 3D mesh and point set.) With this option you can filter cells or nodes while visualizing another property of the same object. To do this, select 'Use as Combined Filter' (the checkbox turns green) and set the filter with the Object Inspector. You can now visualize any other property of the same object (e.g. a 3D grid) while the filter remains active. This way you can apply multiple filters at the same time. To switch 'Use as Combined Filter' off for one property, select it again. To switch 'Use as Combined Filter' off for all properties of the object at once, you can use the 'Disable Combined Filters' option in the context menu of the parent object (e.g. the 3D grid).
Use as Overlay Display the property as a second property on the same surface representation or grid. You have to display another property in order to enable this option. When the property is used as overlay, its checkbox is purple.
Edit... (Only for logs) Opens the Logs form where you can edit existing logs, see Creating and editing logs
Edit (Only for core photos) Opens the Core Photos form where you can adjust the display depth of your core photos, see Edit core photos. 2023.3 This line is deliberately excluded because Core Photos are not yet in.
Duplicate Create a copy of the property in the same folder.
Create (Only for logs)
Create Point set Create a point set from the log data with two properties: 'depth' and <log values>. The point set will be stored in the Data folder.
Colorset Control
Edit Colorset Edit the colorset used for the property.
Show as Residual For residual properties (e.g. depth residual in well matching), improve visibility by applying the colorset S_RedWhiteBlue and connecting the extremes (centered on zero).
Increase Color Gain Subtract 10% from colorset min and max.
Decrease Color Gain Add 10% to colorset min and max.
Equalize Normally, the color scale is evenly distributed over the data range. Turn on equalize to have the color scale evenly distributed across the number of data points.
Tools and operations
Calculate Derivative Calculate a new derivative property (only for time properties). Calculates the difference between a time step and the preceding time step.
Data Format Shows the currently selected data format (for seismic float data only). If your data can be compressed, these data format options are available for selection. If a data format cannot be selected, it will be greyed out.
Property Operations Opens the Property Operations form where you can perform surface-to-surface property operations based on a function.
Property Calculator Opens the Property Calculator with the property selected as 'Target Property.' If the Property Calculator was used to create the property, the Property Calculator will open with the expression that created the property.
Invert Polarity (Only for seismic properties) Use this option to convert the polarity of the selected seismic attribute. Troughs become peaks, peaks become troughs.
Crop Log to Valid Data Range (Only for logs) Remove undefined values from the start and end of the log.
Fill Gaps (Only for logs) Fill gaps in the log using linear interpolation.
Smooth Logs (Only for logs) Open the Smooth Logs form where you can despike your log.
Shift Logs (Only for logs) Open the Shift Logs form where you can apply a bulk shift.
Remove Ranges (Only for discrete logs) Remove consecutive ranges with equal values.
Properties
Show All Classes Show all the property classes of the property.
Hide All Classes Hide all the property classes of the property.
Edit Classes Open the Discrete Property Editor (only for discrete properties).
Statistics
Show histogram Show a histogram view.
Show scatter plot Show a scatter plot view.
Report
Property Classes Report Create a property classes report (only useful for discrete properties). This is placed on the Windows™ clipboard.
Property Statistics Report Create a report of basic statistics (min/max/mean/st.dev., only useful for continuous properties). This is placed on the Windows™ clipboard.
Connected Volumes Report Opens the Connected Volumes report that was generated for the property. Note that a re-calculation of the report is not performed.
View History Open the Audit Trail to view a history of changes, including user name, date, context, workflow process, workflow panel, and description. For more on the Audit Trail, see Using the audit trail.
Export
To .... Export the property in a format that is required for the selected option.
Get updates from DMS DMS can hold multiple version of a single object. One of these is always marked as 'Latest'. The latest version represents the final state of an object.
The 'Get Latest' option is only enabled when you have a version of an object that is parallel to the 'Latest' version. Select this option to replace your version with the latest version.
Delete Delete the object from the solution. Depending on the type of object, geometric representations, subfolders or objects it may contain are deleted as well.