Assigning data to a facies trend map
On the Assign Data form you select the events and the facies log required for creating a facies trend map. The top and base events are selected from the markers available in your Marker Set.
To assign data to your facies trend map
- On the Assign Data form, select the facies trend map from the Facies trend map drop-down list.
- Select the marker set that contains the events that you want to assign from the Marker set drop-down list.
- Select your Top event and Base event which define the interval from which the facies log data is extracted. The Top event and Base event drop-down lists are populated with markers from the previously selected Marker set.
- Select your facies log from which the data will be extracted.
- With an area, you define the position, lateral extent and resolution of the facies trend map. You can either select an existing area from the Area drop-down list, or click on the plus sign (
 ) to create a new area, see Using the Area Tool. You can derive your area from an existing object (e.g. a 2D grid) to align with the existing objects by selecting Autofill parameters.
 - Click Apply to assign data and keep the form open, or click OK to assign data and proceed to the Refine Selection step.
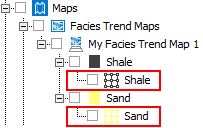
After completing this step, a facies trend map object (as a 2D Grid) per facies class will appear in the JewelExplorer. click to enlarge
Once you click OK or Apply, a dedicated view called Thickness/Trend Map appears in the view area. At this point of the workflow you do not have a facies trend map yet, it will be ready after interpolation. The Thickness/Trend Map view displays values at well locations: each value represents the fraction of the facies along the wellbore within the specified interval (i.e. between the top and base events).
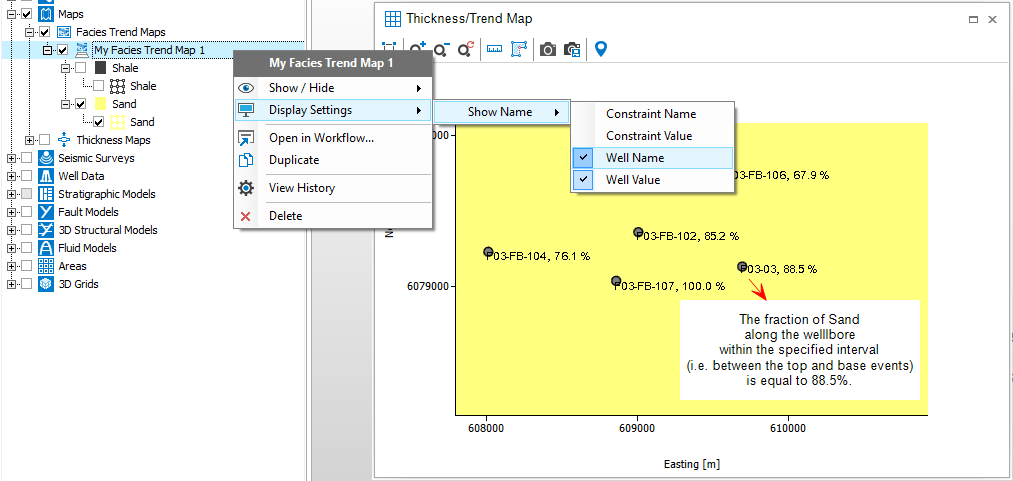
You can change the display settings via context menu options. click to enlarge