Calculating fault stability
With the Calculate Fault Stability form (model > Fault Stability > Calculate Fault Stability) you calculate fault stability for each node or triangle (depending on the chosen mode on the Assign Data form) of the fault tri-mesh(es) using the properties generated with the previous steps of the workflow as input. If your input consisted of multiple time steps, each output property resulting from the fault stability calculation contains the same number of time steps.
Upon opening of the form and selecting the Fault Stability Model at the top, all associated input properties are auto-selected. In most cases you can directly proceed with Apply or OK at the bottom of the form, unless you have multiple pore pressure, fault cohesion or fault friction coefficient properties that you might want to vary, or when want to perform uncertainty analysis, see Incorporating uncertaintybelow.
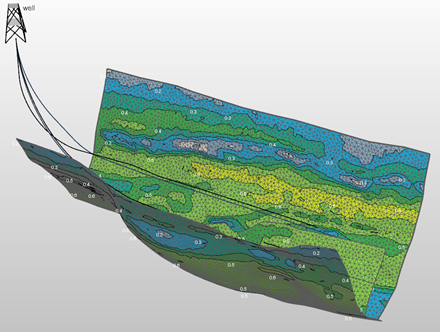
Example of three faults with the tau ratio property visualized. click to enlarge
When the fault stability calculation is finished, the results consist of several properties (optionally with multiple time steps) that can be used to estimate risk of failure, including tau ratio, critical injection pressure and Coulomb failure criterion. For the full list of output properties, see step 5.
To calculate fault stability
- Open the Calculate Fault Stability form and under Model, select the Fault Stability model for which you want to calculate fault stability.
- Upon selection, all the input properties for the fault stability calculation (as generated with the previous steps of the workflow) are auto-selected in the drop-downs on the form. Verify that the correct input properties are selected.
- In most cases you can proceed directly to Apply or OK at the bottom of the form, unless you have different pore pressure properties (or fault cohesion and/or fault friction properties) that you might want to vary, or when you want to perform uncertainty analysis:
- In case you have properties that you want to vary, select these in the corresponding drop-down fields and proceed with step 5.
- In case you want to perform uncertainty analysis, enter the number of realizations in the No. of realizations entry field and proceed with step 4.
- (Only for uncertainty) Once you have entered a plural number in the No. of realizations entry field, the 'Standard Deviation' entry fields located behind each of the input parameters get enabled. Initially all standard deviations are set to 0 (i.e., no uncertainty). Enter the standard deviation for each parameter that you want to include as uncertain in the calculation. See Incorporating uncertaintybelow for information about the standard deviation, sampling and output for uncertainty runs.
- Click Apply start the calculation and keep the form open or OK to start the calculation and close the form. Per tri-mesh the following output properties are generated; Azimuth shear, Coulomb failure function, Critical cohesion, Critical friction coefficient, Critical injection pressure, Critical pore pressure, Dip shear, Sn (effective), Tau and Tau ratio.
- See Tau ratio and Coulomb failure criterion and Critical state expressed by pore pressure sections for explanations about analyzing fault stability with these properties.
- If desired, proceed with Create Point Sets to create point sets for the normal or shear stress components. This enables you to display the orientation and magnitude of the stresses with respect to the fault surfaces.
- You can probe the fault stability results further using the Tensor Probe, which will display the Mohr space representation at locations selected on the tri-mesh faults.
- If you ran multiple realizations, you can use the QC tool Using the Probability Probe to see how uncertainty in the input parameters impacted the result of the fault stability calculation.
The input tensor (i.e., the six tensor component properties as mapped with the Map Stresses form) is not shown as an input selection option on the form but is auto-selected internally by the software. The reason is that only one stress state, and as such only one set of input tensor properties, can be associated with a fault stability model.
You can incorporate uncertainty into your fault stability calculations. You do this by entering the number of realizations and defining a probability distribution for each uncertain input parameter. The probability distribution(s) will be sampled by the Monte Carlo sampling routine during the fault stability calculation. The probability distribution is a normal distribution, which means you only need to define the standard deviation.
When setting the standard deviation for a parameter, make sure to do this relative to the property values. Monte Carlo sampling in the lower ranges (e.g., -2 or -3 sigma) can lead to negative samples when the standard deviation is set relatively high compared to the (lower) values of the property. Note that negative sampling for pore pressure, fault friction and fault cohesion will lead to invalid realizations at those node locations (see next section).
In some cases you might consciously accept negative samples in certain areas of your fault, as the corresponding standard deviation is required to reflect the uncertainty in other (more important) areas. The image below shows an example of negative sampling in areas with low property values.
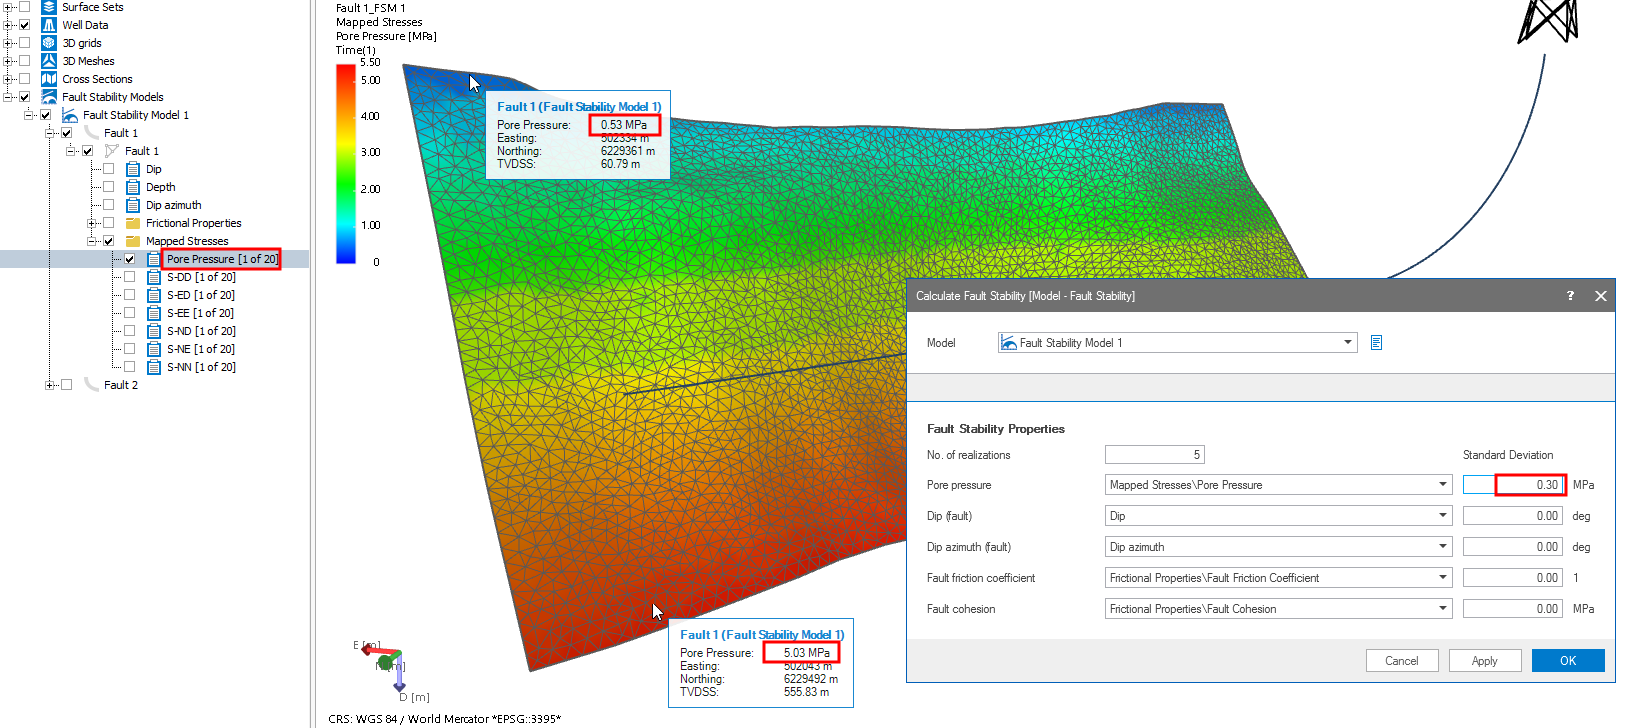
Example showing a standard deviation which leads to negative sampling in those areas where the property values are lowest. The area at the top of the fault (in dark blue) with pore pressures of around 0.5 MPa will end up with negative samples when -2 sigma (or lower) is sampled with the current standard deviation of 0.3 (i.e., 0.53 + (-2*0.3)=-0.07 MPa). click to enlarge
In the above example, the standard deviation of 0.3 will lead to negative pore pressures in the dark blue area at the top of the fault when -2 sigma (or lower) is sampled during the Monte Carlo routine (e.g., -2 sigma for the probed node at the top of the fault would result in 0.53 MPa - (2*0.3) = -0.07 MPa).
When negative sampling happens for pore pressure, fault friction coefficient and/or fault cohesion, the realization will be deemed 'invalid'. The output properties of the fault stability calculation will be set to 'undefined' for that node and the property 'Invalid Realizations' is created. The image below shows the output of the above case, with the 'Invalid Realizations' property displayed. As expected some negative samples occurred at the top of the fault (red arrows).
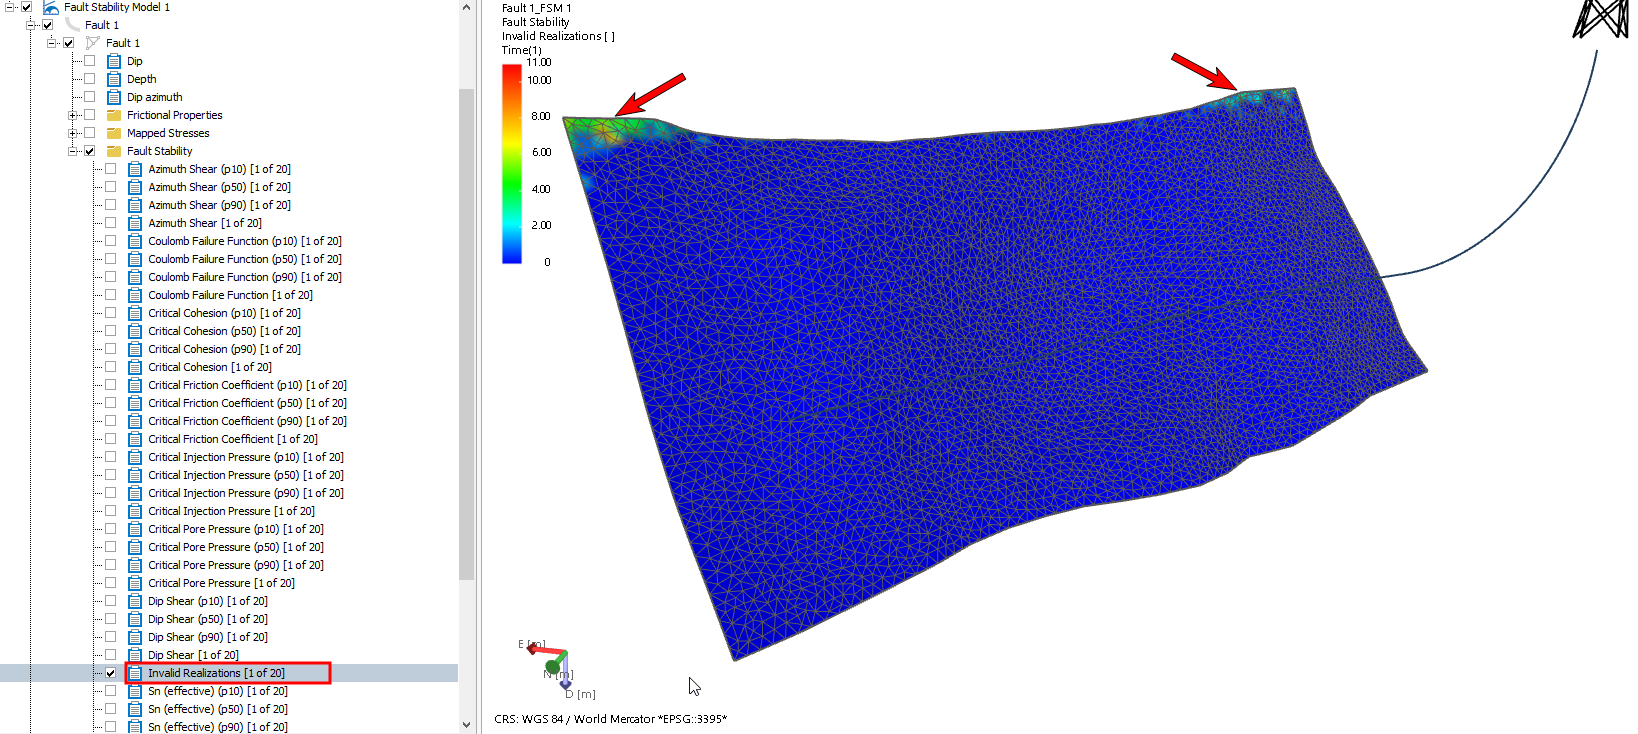
Output of a fault stability calculation with the reference case and P10, P50, P90 output properties in the JewelExplorer. The property 'Invalid Realizations' is displayed, indicating that some realizations with negative samples occurred for the nodes at the top of the fault. click to enlarge
When a fault stability calculation with uncertainty is finalized, the realizations are not kept. Instead, the results of the uncertainty are represented by a P10, P50 and P90 property per output parameter. You recognize these properties by their names in the JewelExplorer (see image above).
Invalid realizations due to negative sampling are not incorporated in the P10, P50 and P90 calculations. As a rough indication, when more than 20% of the realizations (at a certain node location) is invalid, the P10, P50 and P90 properties at that location can no longer be considered reliable.