Using the Probability Probe
When you have multiple realizations resulting from the fault stability workflow (model > Fault Stability > Calculate Fault Stability) you can query the fault tri-meshes for these outcomes with the probability probe. The probability probe is a powerful tool to get better understanding of how uncertainty in the input parameters impacts uncertainty in the resulting fault stability. When you click on a point of interest on a fault in the 3D View, the P10, P50, and P90 results are displayed in the table on the Probability Probe form along with a graphical representation of the results over time (only if you have time steps).
To use the Probability Probe to query and interact with probability data
- Open the Probability Probe form.
- In the 3D View, display the fault tri-mesh that you want to probe (it is not important which property you display on the fault). Click on the tri-mesh in the 3D View. Upon clicking the Selected object and Selected item fields of the Probability Probe form will populate accordingly. The Selected item field will change name to Selected node or Selected triangle, and show respectively the selected NodeID or TriangleID, depending on whether your Fault Stability Model is in 'Node' or 'Triangle' mode (See Fault Stability Model storage type).
- From the Select the P50 property drop-down list, select the property for which you want to see the P10, P50 and P90 results. Based on the P50 selection here, the P10 and P90 properties in the table are resolved automatically each time you click on a new location in the 3D View.
- Optionally, you can create a point set at the clicked location if you wish to have a data point to reference. The point set is added to the JewelExplorer > Data folder and is given the following name: 'Query [Tri-mesh name] [Node ID]'.
- When selecting a new P50 property, click the Update selection button (or click in a different location in the view) to refresh the view and display the new property.
- If you wish to print a copy of the graphical plot you can click the Print plot button, which will open a preview for you to review before queuing the print job.
- When you have finished, click OK to close the form.
If time steps are present, a graph is shown at the bottom of the form, showing the result for the probed location at each time step. If you activate the Time Animation tool (Workspace > Tools > Time Animation), the table and graph respond to each time step.
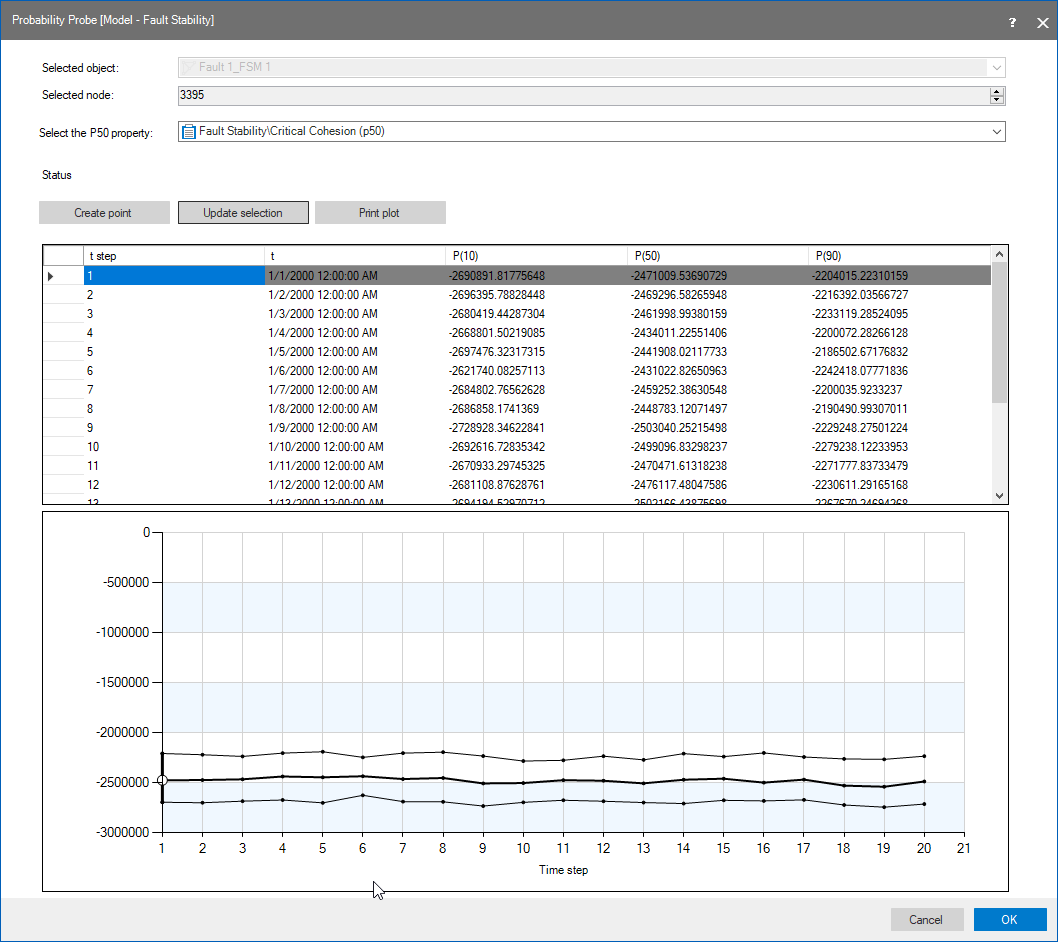
Example of a probed node for the critical cohesion property. The evolution of the P10, P50 and P90 for the critical cohesion over 20 time steps is show as a graph below the table. click to enlarge