Modeling pore pressure
On the Pore Pressure form (MODEL > Geomechanics > 3D Grid Geomechanical Properties > Pore Pressure) you create a pore pressure model for the 3D grid. The input to this model is primarily well data on the basis of which you will try to create a 'recipe' to populate the 3D grid with pore pressures.
To create the pore pressure model
- At the top of the form, under 3D grid, select the 3D grid for which you want to generate a pore pressure model.
- Specify the name of the output pore pressure property: select Create new to create a new property or Use existing to use an existing property. In case you use an existing property, it will be overwritten with the updated settings.
- (Only if you are using well data) In this step you are going to visually inspect well data for any pore pressure changes and based on this information, define a type of ‘recipe’ for pore pressure behavior versus depth across the grid area. In this 'search' for the right parameter settings, you can use the Well View.
-
In this step you will create the reference layers, and then build the pore pressure model as a list of reference layers with the increase or decrease in pore pressure value that occurs (if any), and the gradient you expect in the following interval.
- Under Name prefix, specify a prefix. Each reference layer receives a name consisting of the prefix plus a depth, a tri-mesh name or a k-layer identifier (depending on your choice under (b) below).
- Specify the PP reference layers in one of the following ways:
- Specify a depth for the PP reference level or click Pick from 3D and click the required depth in the 3D view.
- Click Create reference layer.
- Repeat this for each reference layer you want to create.
- Select the tri-mesh.
- Click Create reference layer.
- Repeat this for each reference layer you want to create.
- Select a k-layer or click Pick from 3D and click the required k-layer in the 3D View.
- Click Create reference layer.
- Repeat this for each reference layer you want to create.
In many cases, you will want the top grid to be the uppermost reference layer. To create such layer, choose 'From 3D grid', enter '1' in the k-layer entry field and click Create reference layer (the top of the K-layer will be the reference layer depth). This will ensure the topmost layer starts from top grid.From Z as a fixed depth
From tri-mesh as a reference layer coinciding with a tri-mesh surface
From 3D grid as a layer coinciding with the top of a selected K-layer
- Click in the Reference field and select the first reference layer.
- Click in the Absolute increase field and enter the value with which pore pressure changes at the reference level. This change can be positive (increase) or negative (decrease). If no change occurs, enter 0.
-
Click in the Gradient field and enter a value for the pore pressure gradient in the interval below the reference layer.
-
(Only if you are using well data) In this step you will generate a synthetic pore pressure log. This way you can see whether the model correctly honors the original 1D pore pressure data in the well(s).
Enter the name for the synthetic pore pressure curve in the Log name field at the base of the form ('PP Model' is set by default). Then click Create PP model logs. Upon clicking, two logs are added to the well(s) in the JewelExplorer: the pore pressure model log (in this example called 'PP Model'), and the pore pressure model gradient log (in this example called 'PP Model Gradient').
-
When you are satisfied with the pore pressure model, click Apply to apply the pore pressure model to the 3D grid. The property 'Pore Pressure' will be added to the 'Static Geomechanical Properties' folder under your 3D grid in the JewelExplorer. Verify your results by looking at the 3D model in detail.
ImportantPopulating does not involve interpolation or simulation or any other sophisticated modeling method. The grid cells are populated with pore pressue values according to the model described in the model table and the grid cell’s depth.
- Click OK to move to the next step of the workflow, Horizontal Stress.
In case you have wells with pore pressure data which you want to visually inspect for pore pressure changes, continue with step 3. In case you do not want (or need) to use well information, you can proceed to step 4.
The gray colored sections below contain some tips on Well View settings which come in handy for trend analysis of your well data.
In the Well Selection table, select the well(s) that contain the pore pressure data you want to include in the trend analysis. In the Well PP property drop-down, select the input pore pressure log. Make sure that the pore pressure log exists for all selected wells, else it will not show up in the drop-down list.
Click Create pore pressure gradient log. The calculated gradient log will be added to Well Data > All Logs > Pressure Gradient in the JewelExplorer.
Open the Well View (Workspace > Views > Well View). To show the selected wells with the input pore pressure log and the generated pore pressure gradient log, subsequently select the well(s), the pore pressure log (located under All Logs > Pressure) and pressure gradient log (located under All Logs > Pressure Gradient) in the JewelExplorer. The logs are shown in two different tracks in the Well View.
You can use a curve fill for easier interpretation of the values. To do this, open the Template Editor by clicking the pencil icon (![]() ) in the Well View toolbar. In the Template Editor, at the left side, click on the track that contains the curve you want to fill to enable the Track Settings at the right side (see image below). In the Curve Filling Settings section, click on the green plus icon to add a curve filling and select the following: From= Track Edge, To = <your log>. Select the radio button for curve filling and select a curve filling (e.g. BHI_Property) from the drop-down. Click Apply/OK at the base of the Template Editor. The Well View should look like in the example below.
) in the Well View toolbar. In the Template Editor, at the left side, click on the track that contains the curve you want to fill to enable the Track Settings at the right side (see image below). In the Curve Filling Settings section, click on the green plus icon to add a curve filling and select the following: From= Track Edge, To = <your log>. Select the radio button for curve filling and select a curve filling (e.g. BHI_Property) from the drop-down. Click Apply/OK at the base of the Template Editor. The Well View should look like in the example below.
In the Well View, inspect the well curves and decide where pore pressure changes occur. Are these changes related to the stratigraphy or just to depth? How does the gradient change?
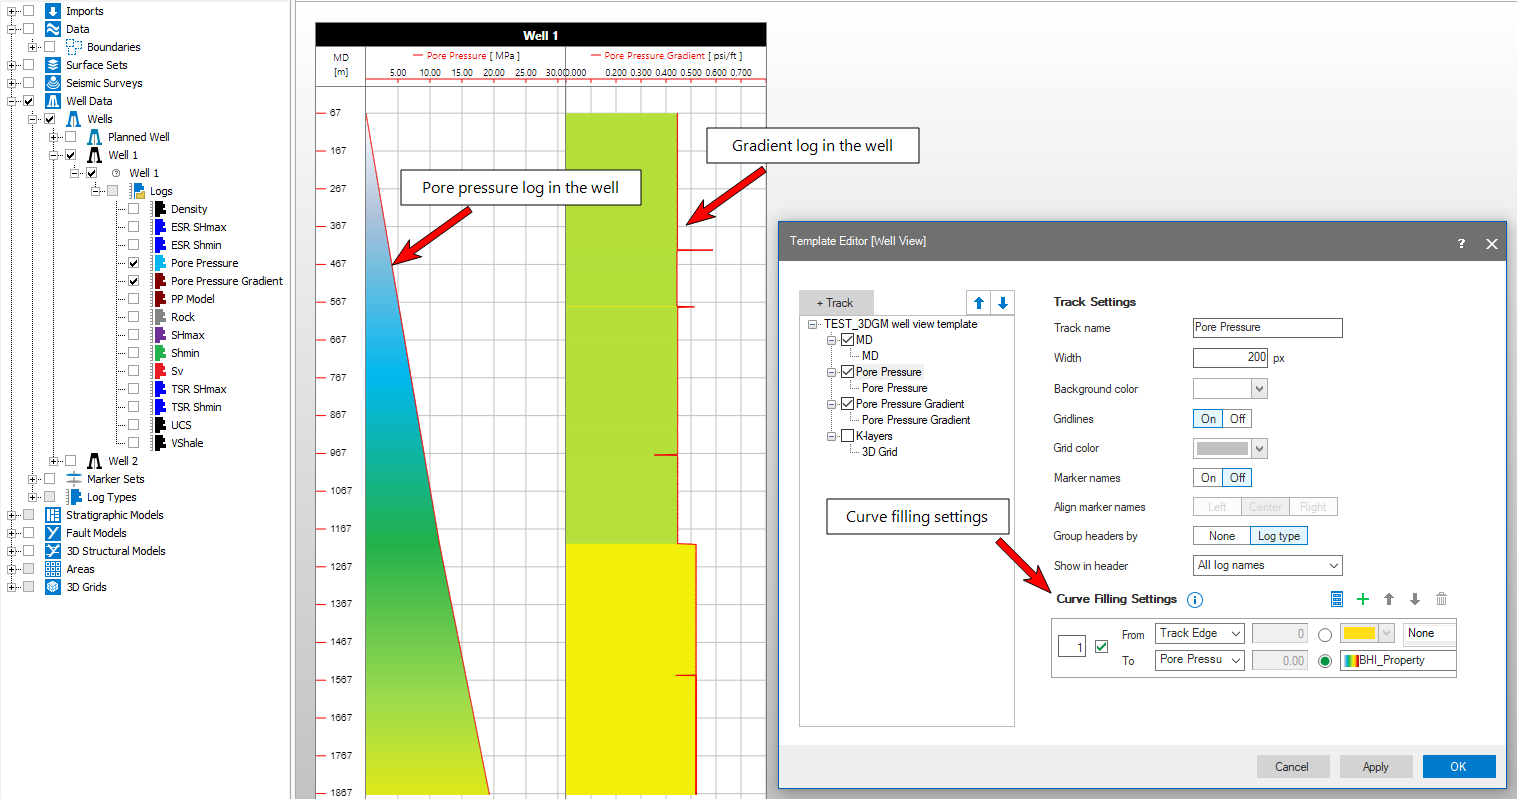
Display the pore pressure log and the pore pressure gradient log in the Well View. Apply curve fillings to exacerbate any 'jumps' in the pore pressure gradient. click to enlarge
When you understand what the gradient changes represent, you can describe the pore pressure as a model consisting of a succession of intervals, divided by so-called reference layers at which changes occur. The change can be a jump in the pore pressure value, a change in the gradient, or a combination of both. You define the pore pressure model in the next steps.
The reference layers are created as 2D grids in the Data > Horizons folder.
Next, you will create the pore pressure model by filling in, for each reference layer, the values in the Pore Pressure modeling table on the form.
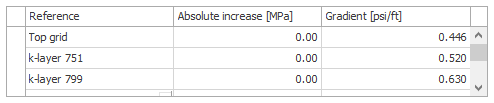
Defining the model by entering the values per reference layer. click to enlarge
In the Well View, compare the synthetic model logs with the ‘real’ pore pressure curve and gradient log of the well. To do this, open the Template Editor again and add the newly created 'PP Model' log and 'PP Model Gradient' log to the existing tracks. To do this, right-mouse click on the relevant track and select 'Add continuous log'. Click on the new continuous log to enable the 'Continuous Log Settings' at the right side of the Template Editor and select the relevant log type and log from the drop-down fields. To distinguish between the well data, apply another color to the model logs.
In the image below, the 'PP Model' and 'PP Model Gradient' logs are displayed in dashed black. The red curves (and their fills) are the well data, similar to the previous image. You can see that 'PP Model' and 'PP Model Gradient' match nicely with the well data in terms of the model 'recipe', but the reference layer depth is some meters off (red circle).
Optimize your model by repeatedly updating the values in the reference layer table on the Pore Pressure form and clicking Create PP model logs. The logs will automatically update in the Well View.
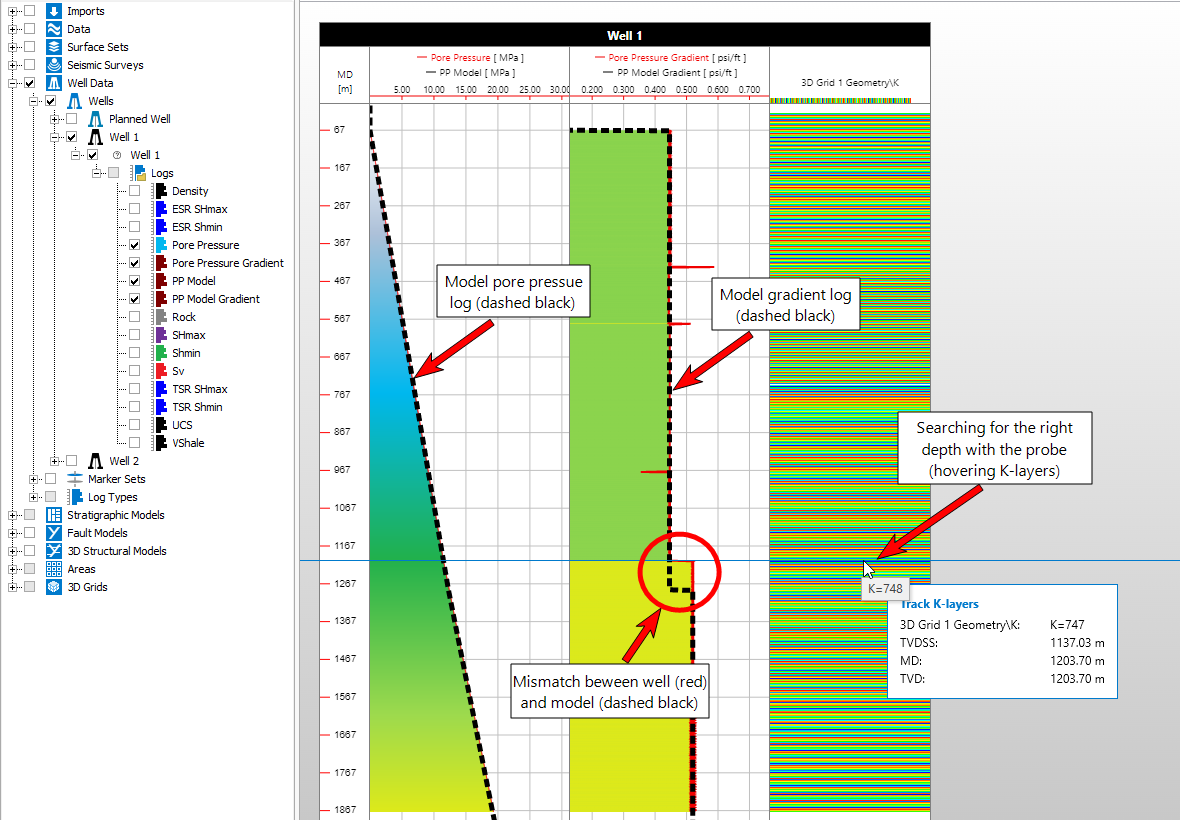
Display the model pore pressure and model gradient log in the same tracks as the well data to compare. Try to match the model with the well data. If you have a 3D grid with K-layers, you can display these and use the probe to find reference layer depths to use in step 5b 'From 3D grid'. click to enlarge
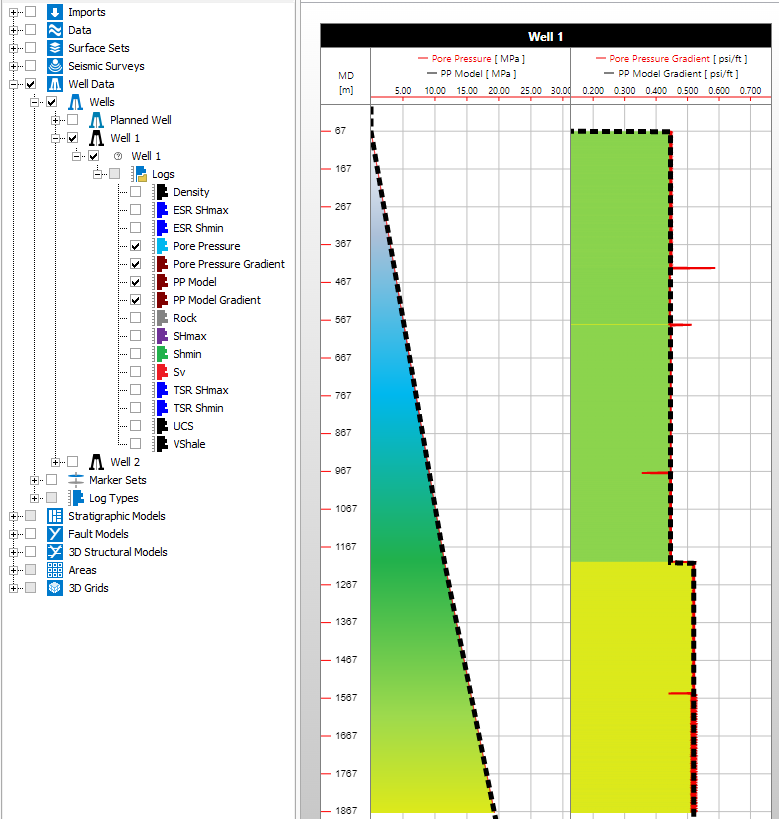
When the pore pressure model and pore pressure model gradient (dashed black curves) show a good match with the pore pressure and pore pressure gradient logs of the well (red curves), the model is ready to be mapped to the 3D grid. click to enlarge