Contours
The Maps & Reports substrip offers tools (model > Maps & Reports > Contours) to extract contours from properties on 3D Grids or surfaces as polylines. These polylines can for example be displayed on a map (in CoView) or exported for use in other applications. Some examples of suitable properties are properties representing CO2 plumes in CCS (Carbon Capture and Storage) scenarios, or temperature distributions for geothermal applications.
Contours can be extracted using two tools:
- 3D Grid to Contours first projects a 3D grid property onto a selected projection surface from this 3D grid, and then extracts polyline contours from that surface.
- Extract Contours extracts polyline contours from any suitable surface with a suitable property. This tool can also run on the outcome of 3D Grid to Contours, for example to test different threshold values on the same projected property. In addition, Extract Contours supports extracting a range of contour values at specified intervals, rather than only a single threshold value.
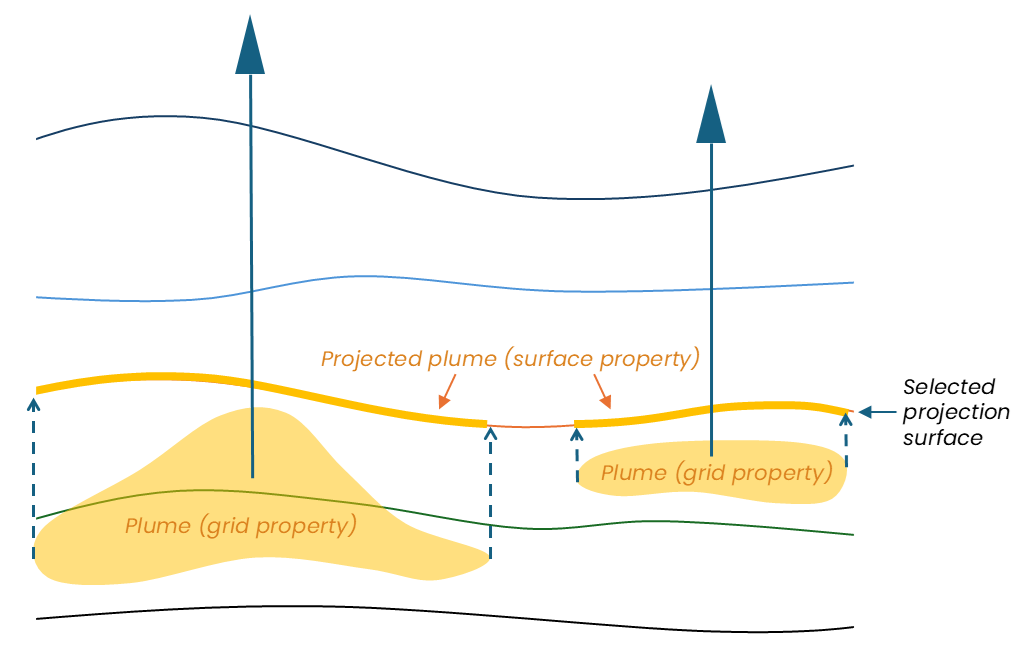
Schematic side view of the projection of a 3D grid property onto a selected surface (also from the same 3D grid). In this example, projection is done without a filter so the property on the entire 3D grid is taken along. The projection is performed vertically, mapping the maximum property value onto the selected surface. The property values are not shown in this diagram, only extent of the plume. click to enlarge
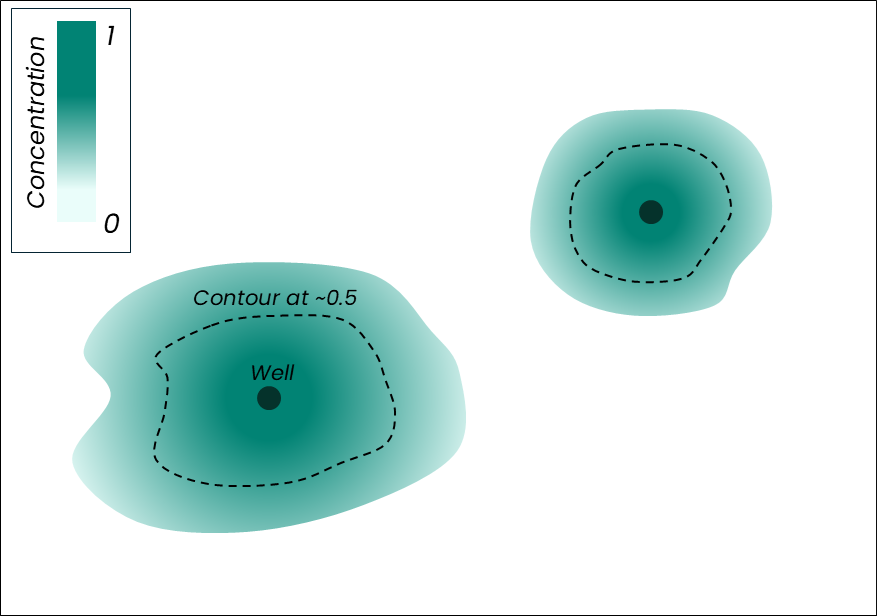
Schematic top view of a projected property (showing the maximum vertical values) of a plume on a surface. This may represent the result of projecting onto the selected projection surface in the previous figure. The dotted line shows an example of an extracted contour at a threshold value of 0.5. click to enlarge
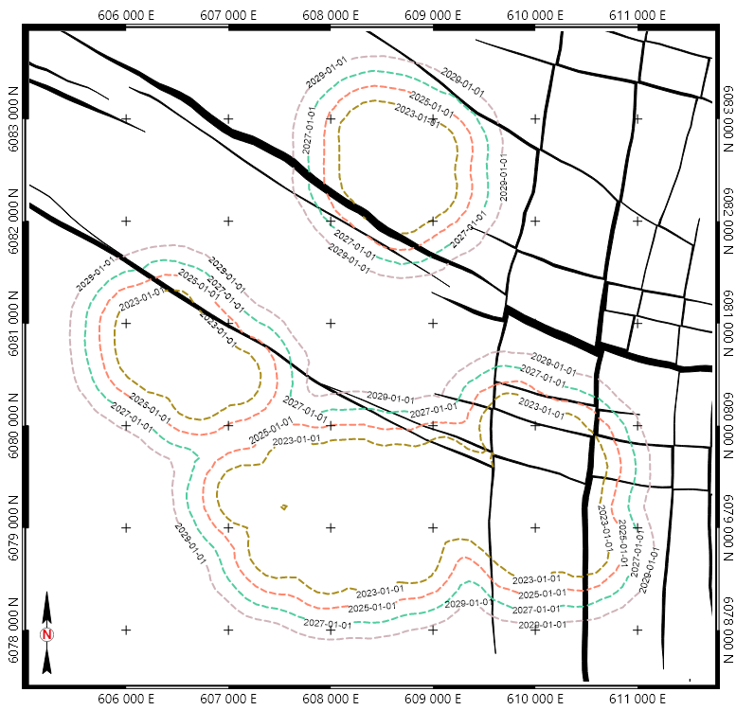
Example of plume contours extracted from a 3D grid property at different timesteps, displayed on a CoView. click to enlarge