Clipping and adding a trend
With the Clipping and Trend form (prepare > Surfaces > Interpolate Property > Clipping and Trend) you can optionally do the following:
- You can select a clipping boundary to clip the output property. All nodes of the surface representation (e.g. the 2D grid or tri-mesh) that fall outside of the clipping boundary will be set to 'undefined'. See Applying a clipping boundary below.
- You can apply a trend to 'steer' the output property. See Applying a trend below.
You can select a boundary to clip your output property. Clipping takes place after interpolation. This means that the interpolation algorithm incorporates all the input data (except input data set to 'inactive'), also any input data that fall outside of the selected clipping boundary. This can mean that much more data is interpolated than what is 'seen' on the final output surface when large areas with input data fall outside of the clipping boundary.
To apply a clipping boundary
- Open the Clipping and Trend form and verify that the property definition of interest is selected at the top of the form, under 'Property definition'.
- Under Method, select 'Boundary Polyline'. All boundaries in the Data > Boundary folder are listed.
- If you want to use a trend, continue under 'Applying a trend' below (only for interpolations based on data, i.e. if you selected 'With Input' on the Assign Data form). If you do not want to use a trend, click Apply and keep the form open or OK to proceed to the next workflow step Create Property.
Trends are useful to 'steer' an output property at those locations where there is no input data. Some interpolation algorithms such as IDW and Kriging typically progress towards the average value in those regions. By using a trend you have more control over these areas.
You can use a planar trend that steers the data beyond your input data via a (constant) increase/decrease in the direction of your choice (see image below). Although you define the planar surface in depth, the trend is deducted from it via the direction and value increase/decrease, and applied to the modeled property. You can also use an existing surface property as trend property to follow more complex shapes. Note that input data is always honored, irrespective of the applied trend.
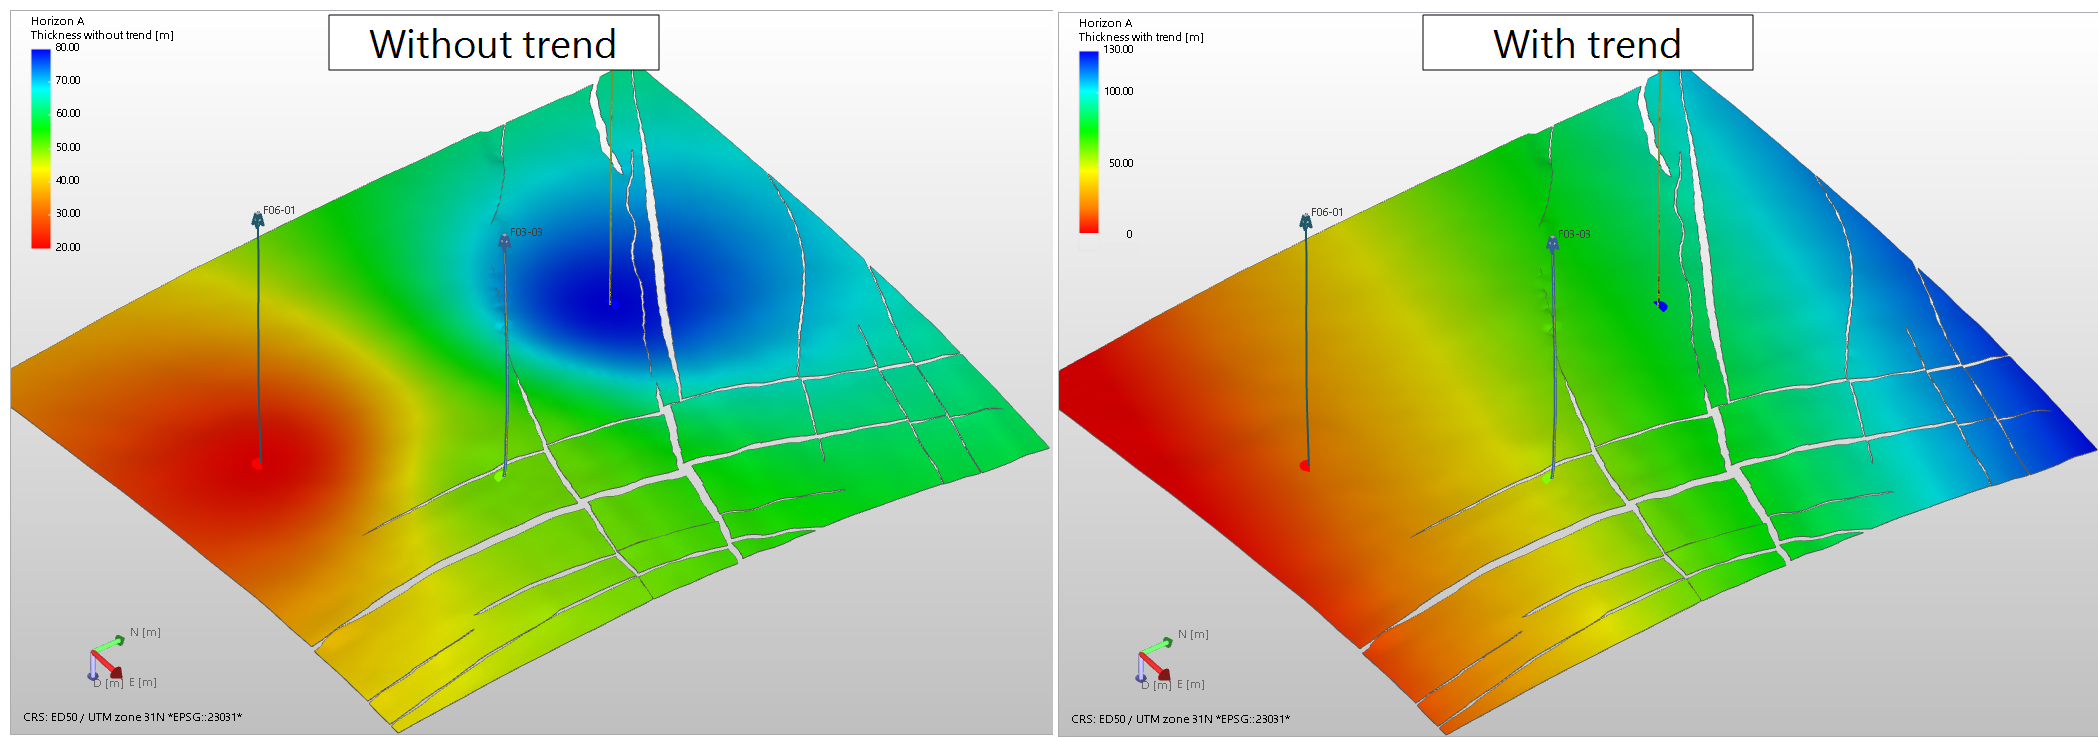
Example of an output property modeled without a trend (left) and with a trend (right). Without a trend, the marker-based thickness property (interpolated with IDW) progresses to the average in areas without input data. Using a planar trend (defined as a surface dipping towards the north from which the trend is deducted) ensures the output property sustains increasing values towards the north. click to enlarge
To apply a trend
- Open the Trends and Projections form.
- At the top of the form, ensure that the relevant property definition is selected.
- From the Trend options drop-down list, select one of the following:
- Planar - The trend will apply a constant increase/decrease of values in specified direction.
- From other data - The trend is deducted from the property values of another surface.
- Make sure the surface lies at the same geographical location as the input data. In case it is not, the trend surface will be extrapolated (not recommended).
- Ensure that the data density of the trend surface is high (markers as trend surface are therefore not allowed).
- Projection settings from data - The application makes a 'best fit' through the input data. The 'best fit' defines the trend. Good option when you have sparse data (for example markers) which show a more or less constant increase/decrease in a certain direction.
- User-defined projection settings - You can manually enter the dip and dip azimuth (GN) of the normal to the trend surface:
- Under dip, enter the dip of the normal to the trend surface. For example, if you have a (virtual) trend surface with a dip of 30 deg., enter 60 deg. (the normal to the trend surface dips 90-30=60 deg. in the opposite direction).
- Under dip azimuth (GN), enter the dipping direction of the normal to the trend surface, relative to Grid North. For example, if you want your trend surface to dip towards the East (i.e. in the direction of 90 deg.), enter 270 deg. (as the normal of the trend surface dips in the opposite direction, i.e. 90+180=270 deg.).
- Under Source, select the source of the trend surface you want to use. Supported source folders are: Imports folder, Data folder, Surface Sets, Seismic Interpretation.
- Under Name, select the event you want to use as trend surface. All events in the selected source are listed.
- Under Representation, select the representation of the event selected in the previous step. Supported representation are: tri-mesh, 2D grid, polyline set and point set (markers are not supported).
- Under Property, select the property that describes the trend. Any property with unit 'distance' (m, ft, etc.) can be used.
- When you have finished selecting your trend input, click Apply at the base of the form to save the selections and keep the form open, or click OK to save the settings and move to the last workflow step, Create Property.
When you use an existing surface property as trend, note the following:
'Planar'
A planar trend means that values increase/decrease with a constant value in a specified direction. Select one of the following options:

|
Set to Default will reset the normal to the default values, i.e. dip and dip azimuth (GN) based on input data. This gives the same result as when selecting 'Projection settings from data'. |
'From other data'