Creating a thickness map
In JewelSuite Subsurface Modeling you can incorporate dense and sparse data representations into your structural model
In some cases this hierarchical alignment may not be sufficient to produce adequate results. For example, dense surfaces created from marker data may not show the anticipated geometry or zones in the 3D grid and you may not obtain the thickness distribution you intend. In this case, you can use the Thickness Maps workflow.
The lateral and vertical configuration of a zone is in some scenarios easier to understand and to handle than the depth of an event and its corresponding surface representation. The thickness of a zone is typically dominated by depositional characteristics. For example a basin fill may show a very gentle change in sediment thickness in a certain direction. Even more complex fluvial systems follow certain geological patterns. A thickness distribution can also change during its geological life time as differential compaction may reduce the thickness in highly porous clay sections much more than sand dominated sections which lack a prominent compaction behavior. All these systems have in common that the thickness distribution is linked to the early depositional circumstances which can be explained and modeled with geological concepts.
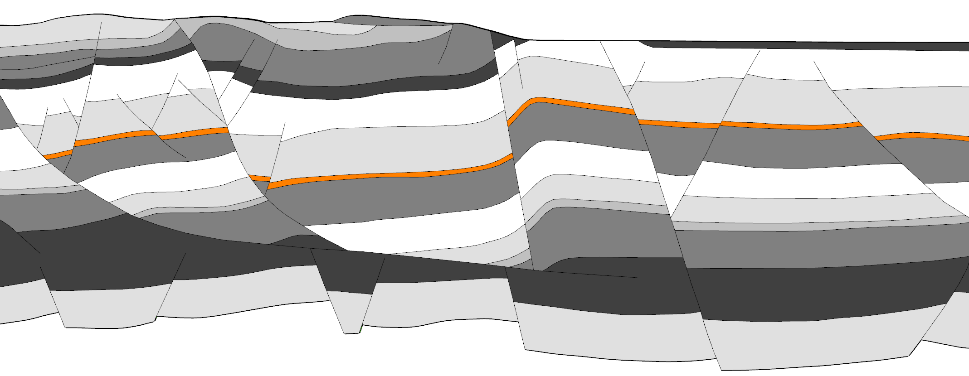
Example of a cross section of a geological model. Note that the highlighted orange layer has some structural complexity but yields an almost constant thickness. (Geological data associated with this cross section is made available under the Open Government License, Contains British Geological Survey materials © NERC 2000) click to enlarge
Any overprinting by structural processes like burial, faulting and to some degree folding adds more complexity to the events that define these zones (see figure above). The thickness of the zones, or the relative depth between the events is however largely maintained during the geological life-time. Therefore it is beneficial in some scenarios to interpret and model an event on the basis of the zone thickness rather than its depth.
In settings where the thickness of a zone is dominated by tectonic processes such as growth faults or salt movement, the thickness distribution provides valuable insight. Tectonic phases can be interpreted or checked based on the thickness distribution as a qualitative measure. The use of a thickness map in these scenarios is often beneficial as the thickness distribution of a zone is commonly less complex than the structural depth of its bounding events.