The Filter Tool
Use the Filter Tool to create and assign filters to series in your charts. You can use one or more properties to filter out values from the data you display in the chart. The properties that you use to filter your primary data can be continuous and discrete. To open the tool, click the edit  icon next to the 'Filter' drop-down in the Data tab on the Histogram Tool and the Scatter Chart Tool.
Use the toolbar at the top of the tool to duplicate, rename, or delete your existing filters.

|
Duplicates the currently selected item in the drop-down list (i.e., the active item). |

|
Opens the Rename dialog, where a new name can be given to the active item. |

|
Deletes the active item. |
Creating a filter
- Select
 Create new from the Filter drop-down list. Optionally, enter the name of the filter in the text field below. By default, a new filter is named as 'Filter <#>'. To modify the name of an existing filter use the rename button
  from the toolbar.
 - Source type Select the source type from the drop-down list. You can select from following: 2D Grid, 3D Grid, 3D Mesh, Marker set, Point set, Polyline set, Tri-mesh, or Wellbore.
- Surface type Select the surface type from the drop-down list, when the source type is 2D Grid, Marker set, Point set, Polyline set or Tri-mesh.
- Folder Select the folder from the drop-down list, when the source type is 2D Grid, Marker set, Point set, Polyline set or Tri-mesh.
- Source Select the source from the drop-down list. (Not available for 'Wellbore' source type) The drop-down list shows all sources of the selected 'Source type' in your solution.
- In the 'Filter Expressions' table on the left side of the tool, click on the filter expression you want to define. The selected row is highlighted in blue. You can use the toolbar to manage your filter expressions.
Adds a new expression. Duplicates the currently selected expression. 
Deletes the selected expression. - Under 'Filter Expression' on the right side of the tool, specify the settings and inputs.
- Name Shows the filter expression you added or selected in the table on the left. You can update the name in the text field.
- Storage type Select the storage type from the drop-down list, when the source type is 3D Mesh or Tri-mesh.
- Property/Log type Select the property type from the drop-down list. This selection acts as a filter. If you choose 'Any...', all your properties in the project will be available in the following drop-down list.
- Property/Log Select the property from the drop-down list. If 'Any...' was chosen for the property type, selecting a property here will populate the field above with the corresponding type.
- Step Active only if the selected property has multiple realizations or time steps. (Not available for 'Wellbore' source type) Select the realization or time step from the drop-down list.
- In the Property/Log Values section of the Filter Tool, you can adjust your filter options. You can use continuous and discrete properties to filter out data values from your primary properties:
Undefined Check the box to show undefined values in the chart. Note that this checkbox is not an indication that undefined values are present.
An indication of the presence of undefined values is when the 'Number of valid values' and the 'Number of values' in the Property Inspector differ.For continuous properties, the Property/Log Values section shows a slider with endpoints corresponding to the minimum and maximum values of the property. You can narrow the value range of the property you use to filter by dragging the slider(s) or entering values in the minimum and maximum text fields. The property values outside of the range you selected are filtered out. Note that the minimum and maximum slider values are included in the visible range. You can change the colorset of continuous properties in The Colorsets pane.
Invert selection Check the checkbox to filter property values outside of the selected range. Note that the minimum and maximum slider values will be excluded from the visible range.
You can change the number of decimals in the 'Minimum' and 'Maximum' entry fields by opening their context menus (right-mouse click in the entry field) and select Format > your preferred format (be aware that this is a global setting, similar to changing the format in home > Settings > Display Units). Other basic context menu options such as Cut, Copy, Paste are available as well.Undefined Check the box to show undefined values in the chart. Note that this checkbox is not an indication that undefined values are present.
An indication of the presence of undefined values is when the 'Number of valid values' and the 'Number of values' in the Property Inspector differ.For discrete properties, the Property/Log Values section shows a property class table with all property checkboxes checked. Uncheck the box(es) of the property classes to filter out property values. To change the colors of a discrete property, use the Discrete Property Class Editor.
Right-mouse click on a property class to open the context menu with the options Select All, Deselect All and Invert Selection. - Click Apply to save the filter settings and keep the tool open, or click OK to save the filter settings and close the tool. The filter is created as a property in the JewelExplorer under the Source type you selected. You can use this output filter property to filter properties in the 3D and 2D View.
- To visualize the effect of the filter on the data in your chart, you must return to the Histogram Tool or the Scatter Chart Tool and save the changes. In the main tool, click Apply and keep the tool open, or click OK and close the tool.
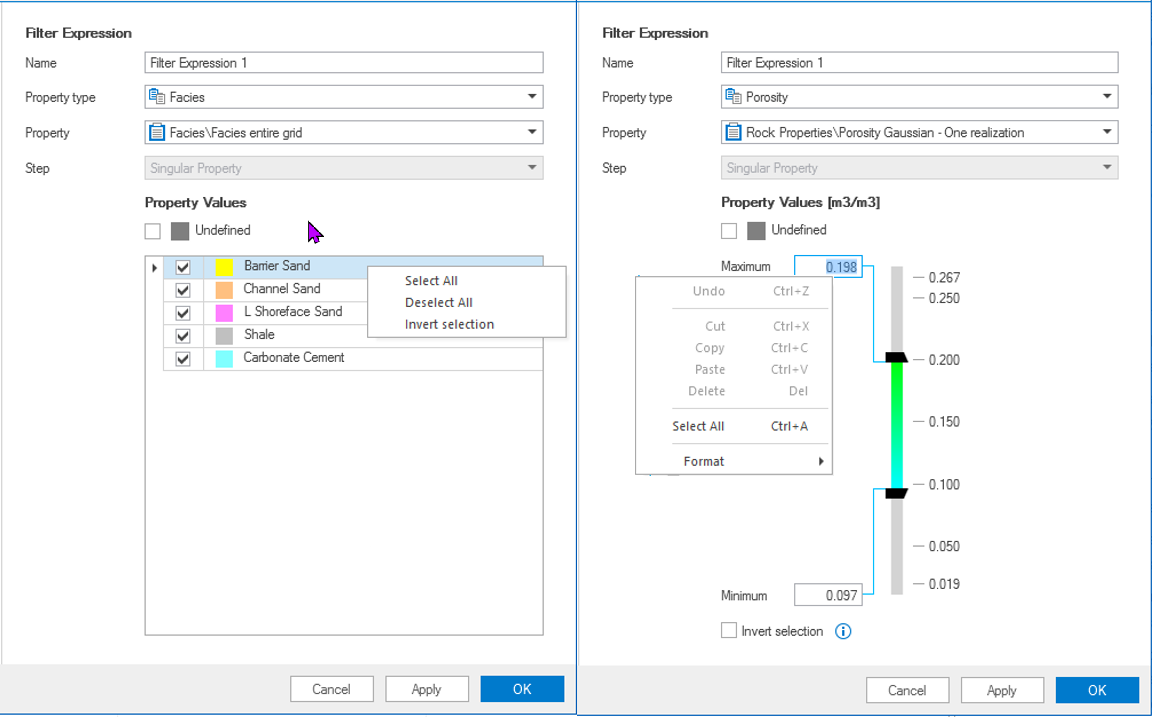
Filter options are available in the Filter Expression section when a property is selected in the Filter Tool. On the left, a discrete property; on the right, a continuous property. Note the context menu options that appear when right-mouse clicking on a property class (left image) or on the minimum and maximum entry fields (right image). click to enlarge