Well View and well correlation
The Well View can be opened via the
Getting started with the Well View - Displaying data
You can visualize each well, log, well event, and marker of interest by checking its corresponding box in the JewelExplorer.
- Well View toolbar - To control general view display options, such as zoom, scale and datuming.
- Template Editor - To control the tracks, log data, colors, fills, line settings and other display considerations. The Template Editor is opened by using corresponded toolbar button or right-clicking on any object visible in the view and choosing the Edit Template... option from the context menu.
Once you have displayed your wells and logs, you can start well correlation. For more on this, see Working with markers in the Well View.
Specific features of the Well View
-
-
-
- The ability to save customized views via a template system.
- The ability to add, delete, edit, view and hide auxiliary information.
- The ability to add, delete, edit and view log annotations.
- The ability to add, delete, edit and view well events.
- The ability to model log trends for continuous log data and generate logs based on trends.
You can display data in the Well View by checking the boxes for wells, markers and logs of interest in the JewelExplorer. With the Template Editor you can further edit the tracks, logs and log settings. Once you have displayed your data, you can datum and filter the data using the associated toolbar.
The Well View allows you
You control the display of data in the Well View using the JewelExplorer, the Template Editor and the visualization options in the toolbar at the top of the view. The JewelExplorer is the most important component of data visualization in the view, as only the wells or well groups that are selected (i.e. have their associated box checked) in the JewelExplorer are displayed. Wells that are not associated with a well group (wells that are organized under the general Wells folder) are displayed in the Well View in the order in which they were initially created. Wells that are part of a well group are visualized in the Well View in the same order as they appear in the well group. For more on well groups, see Grouping and filtering wells.
The template system is an important component of data visualization in the Well View. Using the template system, you can save views that you have created or load other custom and pre-defined views. You can also edit the settings for each track within your template using the Template Editor. See the Well View template system for more information. Once you have the data displayed, you can make further adjustments via the toolbar and the mouse. With the toolbar, you can datum, filter and change the depth projection, among other things.
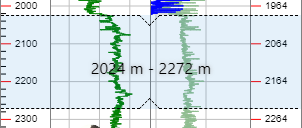
Highlighted area with depth range click to enlarge
You can manually scale the data in the Well View in the vertical direction. To do so, right-mouse click on a track, and drag a box at the depth range you want to view in more detail. While you drag the mouse, the area that will be stretched is highlighted in blue, while the depth range is displayed for your reference.
Well View toolbar
The toolbar at the top of the Well View can be used to change the projection, apply datum and filtering, change the vertical scale and access the Template Manager.
Template Indicates the template to be used in the Well View display. Templates can be renamed, imported, exported or deleted using the Template manager.
![]() Edit Template Opens the Template Editor, which you can use to create and edit templates.
Edit Template Opens the Template Editor, which you can use to create and edit templates.
 Save Depending on the active template, you can choose to save the view to a new template or update the active template. If you click the save button while one of the pre-defined templates is active, your only option is to create a new template (pre-defined template may not be overwritten), and you are prompted to provide a name for the new template. If you click the save button while a custom template is active, you can choose to create a new template or update the active template. Templates with unsaved changes are indicated by the template name being italicized.
 Reapply The reapply option 'resets' the view with the selected template. For example, if you have applied the 01 - Raw Logs template to the Well View and made some changes, such as visualizing additional logs, you can click the reapply button to reset the view back to the original 01 - Raw Logs view, which will remove the additional logs you had visualized.
 Template Manager Opens the Template Manager from which you can rename, import, export and delete templates. The pre-defined templates, listed below, may not be renamed or deleted. Pre-defined templates in the Template Manager:
- 01 - Raw Logs
- 02 - Measured Logs
- 03 - Petrophysical Logs
- 04 - Seismic Calibration
- 05 - Geological Display
 Zoom Displays the current zoom level of the Well View. Select from a number of predefined zoom levels or press Ctrl and scroll the mouse wheel to zoom to a custom level. The reset button allows you to return the value to 100% after the zoom level has been changed.
Scale Controls the vertical scale of the view.
![]() Scale to longest well Scales the view such that the full depth of longest displayed well becomes visible without having to scroll vertically.
Scale to longest well Scales the view such that the full depth of longest displayed well becomes visible without having to scroll vertically.
Measure Controls the depth projection of the view, including TVT/TST projections.
Projection Select the projection, if applicable.
Datum Select the marker you want to datum on. You can set datuming options using the Datum form, opened by clicking the button adjacent to the drop-down box. As an alternative to setting a datum using the drop-down list, you can also right-click the marker of interest and select Set as Primary Datum.
![]() Datum Opens the Datum form where you can specify the depth, active marker set, primary, secondary, or tertiary markers, on which to datum. See Datuming in a Well View for more on this.
Datum Opens the Datum form where you can specify the depth, active marker set, primary, secondary, or tertiary markers, on which to datum. See Datuming in a Well View for more on this.
![]() Probe Activates the Probe tool for use in the Well View. With the Probe tool active, a small dialog box containing various information appears when an object in the Well View is hovered over.
Probe Activates the Probe tool for use in the Well View. With the Probe tool active, a small dialog box containing various information appears when an object in the Well View is hovered over.
 Validation Opens the Marker Validation form where you can validate your markers against a selected stratigraphic model. All invalid markers (i.e. markers that are not picked according to the stratigraphic model) will be listed in the table on the form, and can subsequently be marked in the Well View by clicking the next toolbar icon
  .
.
![]() Filter Opens the Filter form with which you can adjust the Well View filters. You can choose from depth, log, zone or zone+log. The respective button opens a dialog from which you can choose the filter settings. For details, see Filtering in a Well View.
Filter Opens the Filter form with which you can adjust the Well View filters. You can choose from depth, log, zone or zone+log. The respective button opens a dialog from which you can choose the filter settings. For details, see Filtering in a Well View.
Context menu options for objects displayed in the Well View
Right-clicking on any object within the Well View - including, but not limited to, the gray area outside visible objects, tracks, well headers, elements within track headers, logs, markers, well events, the well schematic, and auxiliary information objects - opens the corresponding context menu for that object. The context menu for an object selected in the track body is identical to the context menu for its legend selected in the track header.
Distance measurement
In the margin between each of the wells in the Well View you can find the distance between the two wells. This measurement is taken between the well heads or, if a primary datum is selected, at the datum, and is calculated in a horizontal plane.
Synchronicity with the Marker and Thickness tables
Changes made to marker data in the Marker and Thickness tables are immediately reflected in any open Well View. This includes adding or removing markers, as well as changing depth data for a marker. Likewise, changes made to marker data in the Well View are immediately reflected in the Marker and Thickness tables.