3D Structure Zonation view
With the 3D Structure Zonation view you can directly interact with the Edit Model form. It provides read-only information related to your zonation hierarchy. On the Edit Model form you specify many of the settings prior to surface construction, however, the active zones on the form can only be selected by clicking one of the levels in the 3D Structure Zonation view. This means the view is a vital component of the Structural Modeling workflow. In addition to this functionality, the view also displays information related to the zones and the geological events assigned to those zones.
Accessing the 3D Structure Zonation view
The view is opened automatically when opening the Edit Model form. The Edit Model form responds to clicks in the 3D Structure Zonation view. The label just above the hierarchy, which reads '3D Structure Zonation View', identifies the view. Upon opening, the zonation from the assigned stratigraphic model is displayed.
Visual indicators in the view
Example of the visual indicators provided in the 3D Structure Zonation view click to enlarge
The view differs from the similar Stratigraphic and 3D Grid Zonation views in that zones cannot be modified in respect to their hierarchical position. The diagonal line pattern applied to the hierarchy here is used to represent the read-only status of the zones. Changes to the stratigraphical hierarchy need to be carried out in the stratigraphic model. In the 3D Structure Zonation view you can still edit the zone name and see the layer alignment from the Edit Model form.
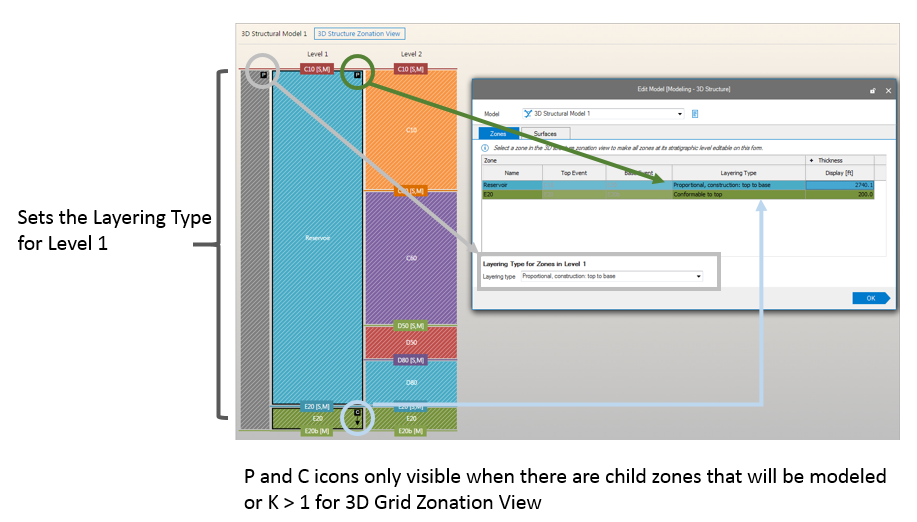
Information regarding the events and zones is displayed using visual indicators. Top and base events can be identified easily as colored labels. Indicated in the label is also an indication of the underlying data representation, a surface or marker, indicated by an [S] and/or [M] following the event name. This allows you to quickly identify the data being used to constrain zones without having to check in the Edit Model form. In addition, the Layering Type set in the Edit Model form for zones with child zones is indicated in this view with P and C icons at the top or the base of a parent zone. The P icon is shown when the layering type Proportional is chosen in the Edit model form; the placing depends on the selection of top to base (placed at the top) or base to top (placed at the base). Conform top or Conform to base is indicated by a C and arrow, also, the placement is either at the top or at the base depending on from what side the child zones are constructed, starting either from the top or the base.
When a zone does not have any child zones the layering type cannot be set and no layering type indicators are displayed in the zones
Another important visual indicator is the probe, which is activated in the 3D Structure Zonation toolbar or using the shortcut key Ctrl+I. This probe displays the zone name and the names of the constraining events in order to aid you when reviewing information for large and complex hierarchies. Because, in this case, the application will hide information that would otherwise clutter the display of such a complex hierarchy, the probe allows you to quickly view this basic information for every zone.
3D Structure Zonation view toolbar
The features in the toolbar at the top of the 3D Structure Zonation view allow you to change the vertical zoom level of the view, change the zone thickness display size and view basic info for each zone in the hierarchy.
Zoom You can vertically zoom the view in two ways: by pressing Alt and scrolling to the desired zoom level, or by using the Zoom text box to select a level. With the zoom box you can type in a zoom value or select from the drop-down list. If you select a zone in the view and use Alt + scroll to zoom, the selected zone will stay focused in the view.
![]() Reset zoom Clear all zoom changes, resetting the zoom level back to 100%.
Reset zoom Clear all zoom changes, resetting the zoom level back to 100%.
Zone thickness display Set the display of the zones on the lowest hierarchical level to relative (default setting) or equal. In equal thickness mode all zones are equally thick on the lowest hierarchical level present in the view. See the section below for more details on this setting.
Information
- Activates the Probe
 (shortcut key: Ctrl+I). When you hover over a zone the Zone name and top and bottom events are displayed.
 - Activates the Building Sequence View
 . Clicking this icon opens the The Building Sequence View
Zone thickness display
By default, the zone thickness display is set to Relative, where the average zone thicknesses are taken from the input horizons or markers. This thickness is also reflected in the Thickness column of the Edit Model form. When the zone thickness display is set to Equal, all zones on the lowest hierarchical level are displayed with an equal thickness. This is particularly useful if you want to quickly get an overview of all available zones, especially when there is a large thickness variation between the zones (e.g. large overburden). The image below demonstrates the difference between the Relative and Equal zone thickness display settings.
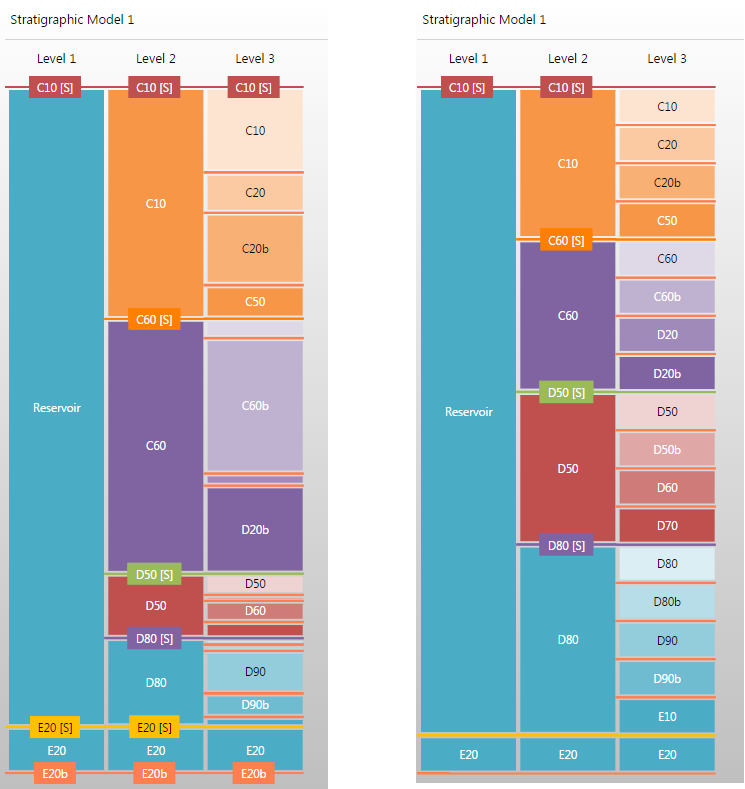
The stratigraphic model, Stratigraphic Model 1, displayed using Relative zone thickness (left image) and Equal zone thickness (right image) click to enlarge