About colors and colorsets
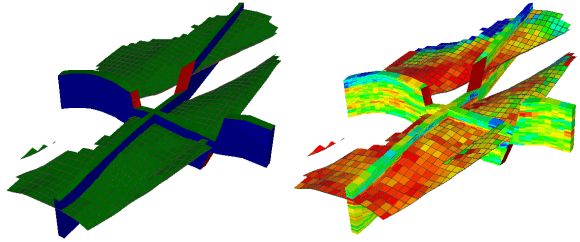
Example of a JewelGrid with object colors (left: blue for sides, red for faults, and green for top) and property colors (right: a certain porosity value is displayed for each cell) click to enlarge
You can visualize
When displaying objects, the colors used depend on whether you are displaying a property. If you have selected a property for display in the JewelExplorer, the property colorset will be used to show the object properties. If no property has been selected in the JewelExplorer, the object colors will be used to display the object.
You can specify both the object colors and property color sets using either the object context menu, or the Property Inspector  (Workspace > Panes > Inspector).
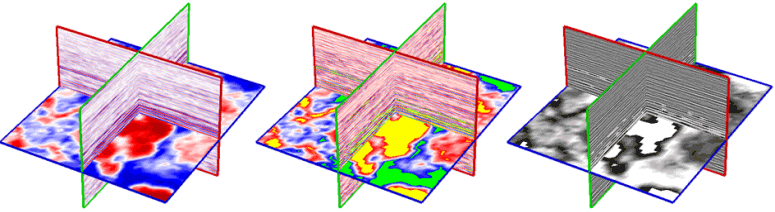
The same seismic amplitude volume using three different color sets click to enlarge
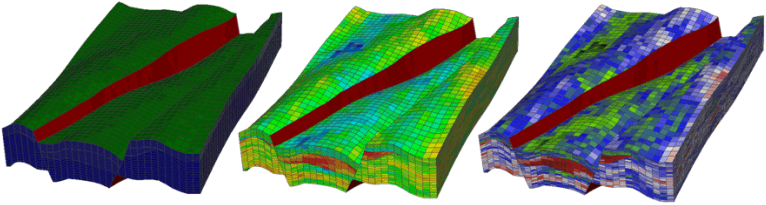
The same grid object using the grid colors (green for surfaces, blue for the sides, and red for the faults), and using two different property colorsets for one of the grid properties click to enlarge
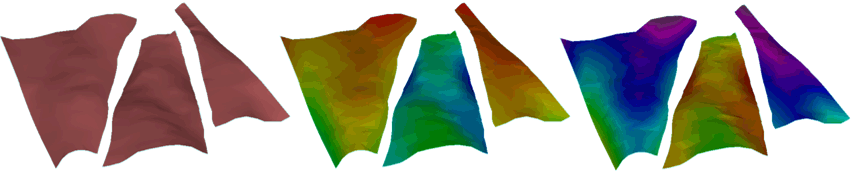
The same tri-mesh object in three different ways using the tri-mesh colors (brown in this example), and using two different property colorsets for one of the tri-mesh properties click to enlarge
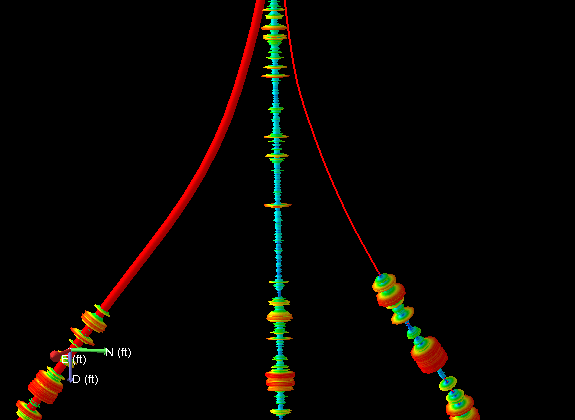
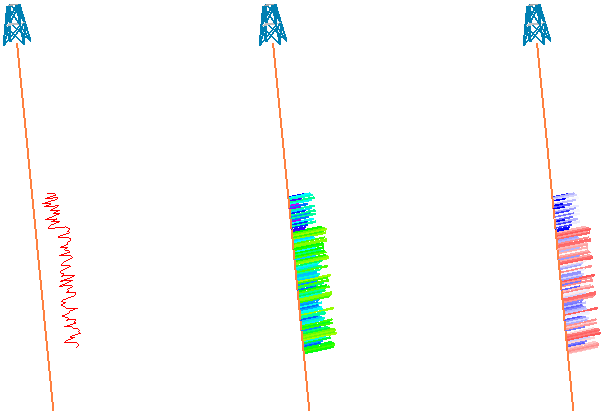
You have a number of visualization options for wells, wellbores and logs. Below are two different types of wellbore renderings, cone shape and line, while the log is visualized in 3D. The second image shows three different ways of using the log colors (red in this example), with two different colorsets. The well derricks and the wellbore trajectory can also have different colors.
Wellbore renderings click to enlarge
Log colors. Object colors (left) and two different property colorsets click to enlarge
You can also use the Colorsets pane to create and edit colorsets and save them for use as your default colorset for other projects. For more on this, see The Colorsets pane.