Display sequence
Cross sections allow you to display many objects simultaneously as intersections or projections, in particular in Cross Section Views. A fixed display sequence is used to generate meaningful displays quickly. From back to front this is:
- Canvas (the cross section canvas)
- 3D seismic data or any voxel grids
- 3D grids (geological and simulation models)
- Polylines
- Tri-meshes and 2D grids
- Wells, logs and markers (only in the Cross Section View, not when displaying a cross section in the 3D View)
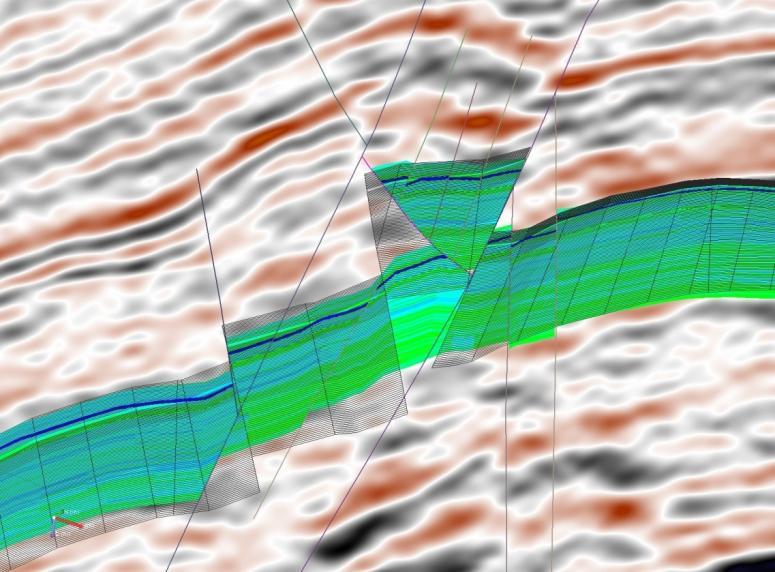
Co-visualization of two 3D grid models with seismic backdrop click to enlarge
In the image above, a 3D grid is shown in solid mode with PHIE as the display property. A second 3D grid is shown in mesh mode. The colored vertical lines are intersections with fault planes from seismic interpretation.
Co-visualization of two different 3D objects is fully supported and one of the most powerful options when using cross sections. For example, with this tool you can QC the resulting 3D grid against the 3D seismic cube. In addition, you can set the transparency of the 3D grid model for easier visual comparisons.