Editing a Vertical Trend Curve
The VTC form (opened from the Vertical, Lateral or 3D option on the model > Rock Properties > Conditioning form) enables you to calculate and exert control on changes of rock properties on a k-layer by k-layer basis. Additional control on the vertical distribution of properties helps to generate more realistic geomodels.
The Vertical Trend Curve form
On the form, two data charts are visible, the Upscaled (left chart) and the Target for Modeling (right chart), see image below.
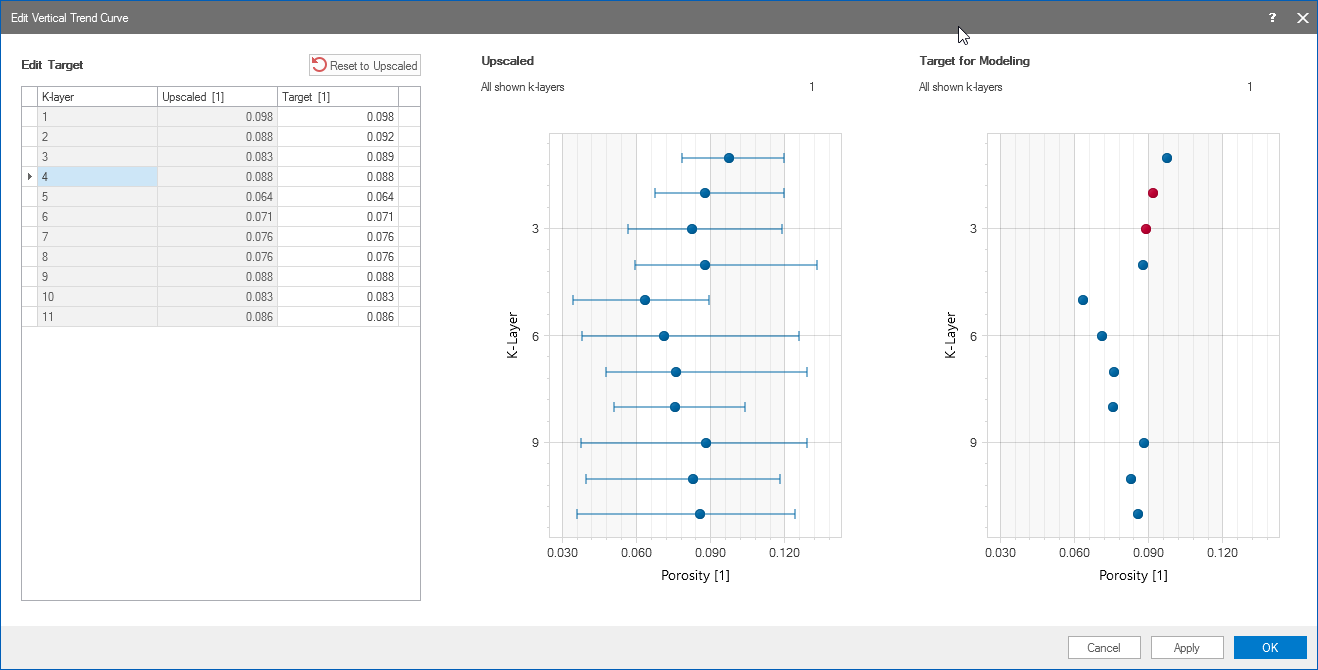
The VTC form. Use the table on the left hand side to edit the targets per K-layer click to enlarge
The Upscaled (left chart) are the calculated properties of the upscaled property from continuous well data whose trajectory intersects the k-layers within the zone of interest. This chart is for inspection purposes only and not editable.
The right chart (Target for Modeling) is showing the edited input property values. You can edit per k-layer using the table on the left side of the form.
Editing rock properties in the table
The table at the left side of the form allows you to change rock properties per k-layer by directly entering values in the table. The 'Upscaled' column is greyed out and not editable. The 'Target' column is available for editing.
To edit the values:
- Select the relevant K-layer.
- Type your preferred value, press tab on your keyboard to end entering mode. The data point that is edited will turn red in the Target for Modeling chart.
You can always retrieve the initial (upscaled) values by clicking the  symbol on the form; this will reset your edits.
When you are finished editing the rock properties, click Apply to save the edits and keep the form open, or click OK to save the edits and exit the form.