Graphical controls in the Variogram View
Graphically editing the variogram curve
The Variogram Control Area provides the following options to specify the variogram:
Filter If you have defined a filter and checked the option Separate output for each selected item in step 3 on the Statistical Analysis form, an additional selection list is visible where you can select the filter classes for which the variograms must be shown.
Indicator This selection box is available when the variogram analysis was done on a discrete property (lithology, facies). It allows you to select a discrete property class (indicator) for results analysis. For each property class, separate variograms are created. All of them can be stored by clicking Save to manager.
There is also a General option in the selection list, in case you wish to analyze an average variogram of all property classes (indicators).
Direction type
Lateral omni-directional This allows you to analyze your variogram data in both lateral direction and vertical direction; only two variogram charts are available: Lateral and Vertical direction.
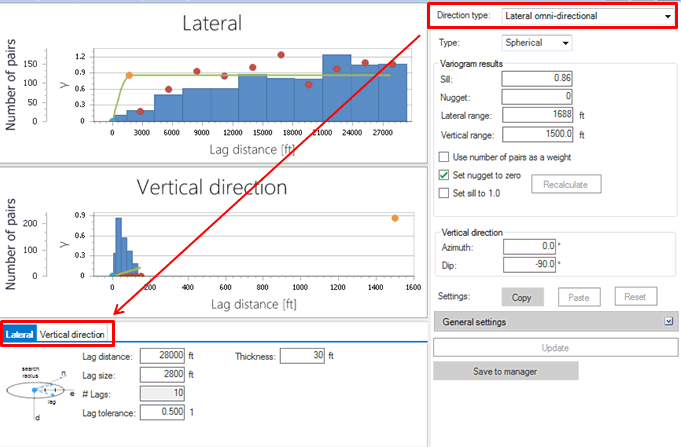
Two variogram charts are available click to enlarge
Directional This allows you to analyze your variogram data in all three directions: major, minor, and vertical. For each direction, a separate variogram chart is available.
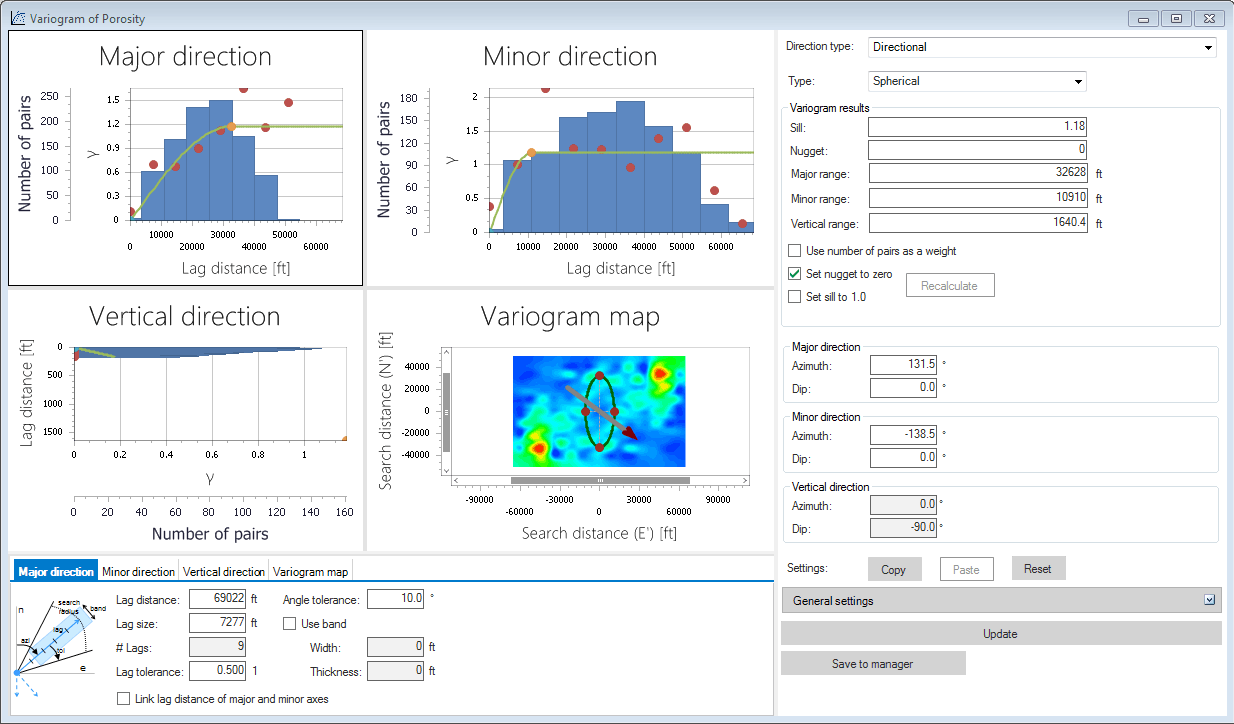
Three variogram charts are available click to enlarge
Omni-directional This allows you to analyze your variogram data using only one direction; only one variogram chart is available.
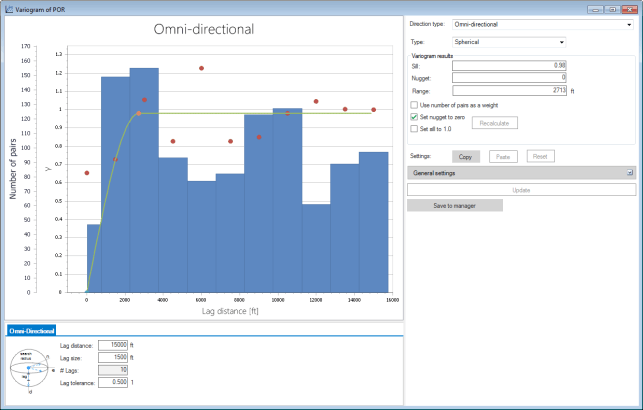
One variogram chart is available click to enlarge
Type Specify the variogram type for variogram data fitting. There are three types available: Spherical, Exponential, and Gaussian.
Variogram results These controls show the calculated variogram parameters based on the selected variogram type:
Sill The semi-variance where the variogram levels off (semi-variance for independent property values).
Nugget The semi-varianceat an infinitesimal small lag size.
Major range The lag distance on which property values become independent (curve reaches its plateau) in major direction.
Minor range The lag distance on which property values become independent (curve reaches its plateau) in minor direction.
Vertical range The lag distance on which property values become independent (curve reaches its plateau) in vertical direction.
The following controls allow you to recalculate the parameters of variogram curves:
Use number of pairs as a weight If this option is checked, then number of pairs is taken into account when calculating the variogram results.
Set nugget to zero By checking this option you can force a nugget value to zero when calculating the variogram parameters (results).
Set sill to 1.0 By checking this option you can force a sill value of 1.0 when calculating the variogram parameters (results).
Recalculate Click this button to re-fit the variogram to the calculated results (red dots) according to the settings in the workflow panel in case you changed any of the above parameters.
You can edit all these values to override the calculated values. When you change the calculated values, a user-defined variogram curve in the Variogram view will be shown (the purple line) on top of the calculated variogram curve (the green line).
Major direction These controls allow you to specify the major direction for the variogram calculation. The major direction is defined as the direction of the largest spacial continuity. When investigating the major direction on a variogram map, it is the direction where the change in color (change in the variance) is smallest.
Azimuth Specify the azimuth direction
Dip Specify the dip angle
Both values can be entered. This option is available only for the variogram of Directional type. Behind the azimuth and dip values, the possible angle ranges are displayed.
Minor direction These controls allow you to specify the minor direction for the variogram calculation:
Azimuth Read only value of the azimuth direction.
Dip Specify the dip angle.
Only one of the two values can be entered, since the minor direction depends on the specified major direction in previous control. This option is available only for the variogram of Directional type. Behind the azimuth and dip values, the possible angle ranges are displayed, calculated from the specified major direction.
Vertical direction These controls show the vertical minor direction for the variogram calculation:
Azimuth Read only value of the azimuth direction
Dip Read only value of the dip angle
Both values are read-only, since the vertical direction can be calculated from the specified major and minor direction in previous controls. This option is available only for the variogram of Directional or Lateral Omnidirectional types.
Settings Buttons Copy, Paste and Reset aim to work with variogram setting for different property classes (discrete property, indicator variogram) or for different filter classes. So, this option is only available in case indicator variograms are created or (and) filter is used.
General settings The following general variogram settings are available to generate the Variogram view (note that these are the same options that can be specified on the Model Statistics panel; these are added again on this control for convenience):
Total calculation Select this option if you want to use all pairs available in the selected property. This option gives the most accurate variogram, but can result in a time consuming calculation in case of large properties.
Partial calculation Select this option if you want to use a part of the possible pairs of the selected object and property to speed up the variogram calculation. An average number of pairs per lag need to be specified, which is the average you believe is needed for a valid variogram chart. In this case of calculation, random pairs from properties are added to the variogram results to achieve the average number of pairs in each lag.
Normalize data for input to simulation This option will transform the selected property data into a normal scored, which means a normal distribution with a mean value of 0 and a standard deviation of 1.
Update Click to apply ANY change to the variogram that you have made on either the General settings, or in one of the Variogram Direction Controls, or if you change variogram directions (Major direction, Minor direction, Vertical direction).
Save to manager Click to save the current variogram results to the Statistics Manager. You can give the results a name when you save it. Saved information can only be used in the Property Calculator.
The variogram Direction Control area click to enlarge
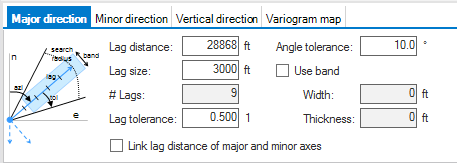
The Variogram Direction Control Area has a tab for each variogram that is displayed in the Variogram view. The number of tab controls depends on the selected Direction Type.
All tab controls have nearly the same specification options. Obviously, each of these options applies only to the direction specified by the tab. To increase or reduce the data points used in the calculation of a lag, you can alter the lag size.
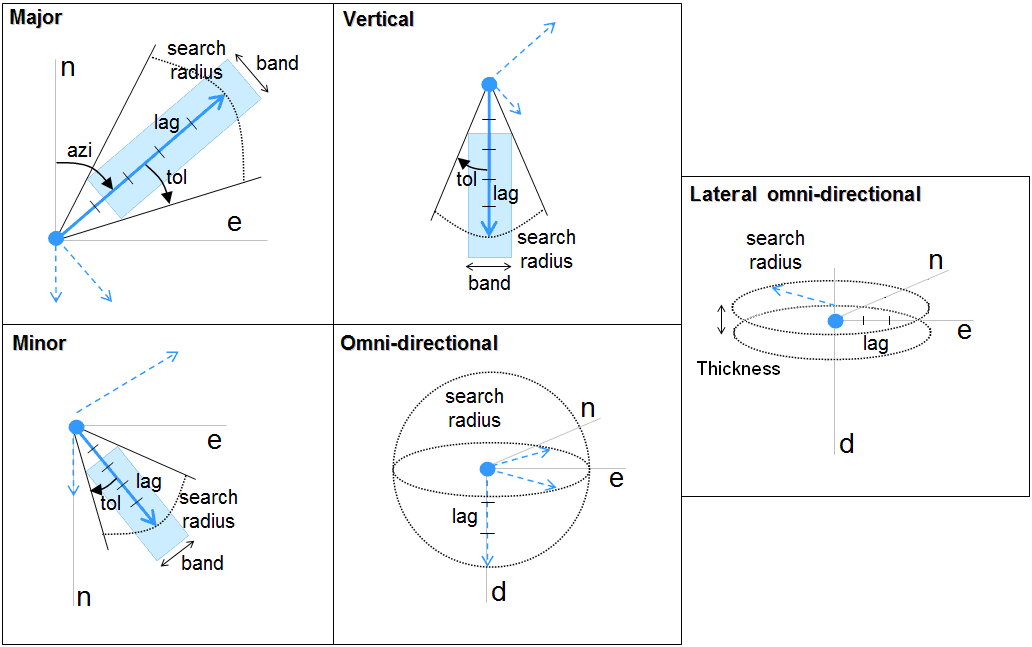
Variogram direction and corresponding variables. All the directional variables can be specified in the corresponding direction tab controls click to enlarge
Search radius (or Lag distance) The Search radius is the distance within which all input data points will be used to calculate a Variogram.
Lag size This control allows you to specify the lag size in specified direction.
# lags This control shows you the calculate number of lags in the specified direction. This control is read-only and is calculated using the Lag distance divided by the Lag distance.
Lag tolerance This control specifies the tolerance used for each lag when calculating the variogram in specified direction.
Angle tolerance This control specifies the Angle tolerance when calculating the variogram in specified direction.
Use band Option to use a band width when calculating the variogram in the specified direction. When using this option, you need to specify Width and Thickness.
Link lag distance of major and minor axes Check this option to synchronize the input controls between Major and Minor direction. With this option checked, changing a variable on the Major direction tab will update the same variable on the Minor tab. This option allows you to mimic Lateral omni-directional variogram analysis, but without losing the option to change the lateral directional settings. This check box is only available for Directional variogram type.
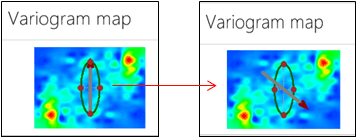
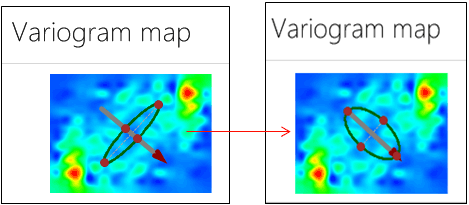
Changing the range of a variogram using the variogram map
To use the Variogram map to change the range of a variogram:
- Create initial variogram.
- Inspect the variograms in all directions.
-
Inspect the variogram map and change the azimuth of the major direction by rotating the arrow in the direction of the largest spacial continuity (i.e. the smallest change in color). The direction of the arrow is an indication for the azimuth, the size of the arrow is an indication of the range distance.
click to enlarge
-
Click Calculate.

click to enlarge
- The major and minor range of the variogram are calculated, based on the new major direction.
-
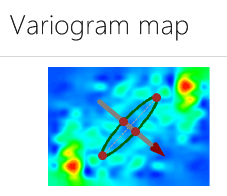
Right click on one of the red dots of the ellipsoid to change the shape and size of the ellipsoid around the arrow in the variogram map. If necessary zoom in using the scroll wheel on your mouse. A new major range and minor range are automatically calculated.
click to enlarge
- Inspect the variogram in all directions again. If the current settings result in a variogram that you want to use press save to manager.
Using the Variogram context menu
The Variogram context menu provides the following options to specify the variogram:
Unit Use this option to change the units (cm, ft, in, m, etc.) of the selected axis.
Format Use this option to change the format of the selected axis.
Show “Number of pairs” axis Toggle on to display the number of pairs axis.
Contouring steps This option is only available when the type of map display is Triangulated or Bicubic. The different amounts of steps that can be selected are: 1, 3, 5 or 8. The selected number defines the number of steps used for contouring.
Type of map display Select the display type for the variogram map. Choose between Triangulated, Nearest Neighbor or Bicubic. By default the map will be displayed using bicubic interpolation.
Options Use these options to modify the settings of the variogram. The Chart Options Dialog opens at the relevant element, depending on the position of the mouse in the view. See Chart Options.
Export Use this option to export the data to clipboard so that it may be pasted into other applications.
Annotation Displays the number of samples used for a bin. Only available for a histogram in the variogram chart.