Histogram view
- The chart area is where the histogram is displayed.
- In the settings panel are additional controls to calculate the histogram.
- The context menus, shown by right-clicking in the chart area, offer various chart customization options.
- The Histogram toolbar at the top of the view, which provides options for controlling the zoom level and other elements of the view.
- The Chart Options form can be opened from the context menu and provides various chart customization controls. It is available on every chart, see Chart Options.
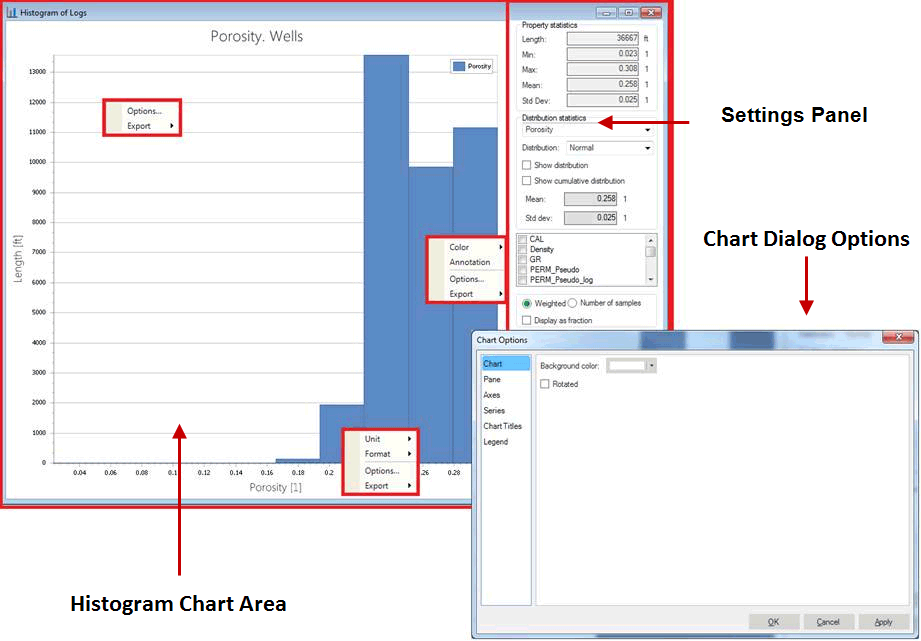
The Histogram view click to enlarge
Using the Settings Panel
The Settings Panel provides the following options to specify the histogram:
Property statistic information This box in the top right corner displays the calculated Min, Max, Mean, and Standard deviation values of the current selected property data. This information is shown when the chart view contains a single histogram for a continuous property. Depending on the selection made in step 4 (Create statistics) on the Statistical Analysis form, also visible in this area is:
- The number (#) of samples for which the histogram is calculated
- Total Volume (grids) or length (wells) for which the histogram is calculated
Distribution statistics These options allow you to visualize a distribution inside the histogram chart. The following distribution types are available: Normal, Lognormal, or Triangular distribution. Based on the selected distribution type, the calculated distribution parameters will be displayed: Mean and Standard deviation for the Normal and Lognormal types, the Minimum, Maximum, and Peak for the Triangular distribution type. This information is shown when the chart view contains a single histogram for continuous property.
Select a different property Located below the Distribution statistics area, you can select one or more properties of the same type to be displayed in the histogram. If you change the property selection here, it will override the initial property selection made in the Statistical Analysis form. However, all applied filtering options will remain.
Select a different property time or realization In case you select a time or realization based property with several time steps or realizations an additional selection list is made visible where you can select a specific property time or realization step you want to analyze.
click to enlarge
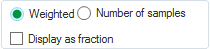
Weighted or Number of samples Weighted checked: This option allows for weighting property values in the generated histogram. The object selected in the Statistical Analysis form determines the setting used. If you don’t want to apply weighting, check the Number of samples option.
Check Display as a fraction to display the vertical axis distribution as fraction.
Number of bins Specify initial number of histogram classes / bars you want to create. When analyzing a discrete property, this option is disabled because the number of bars is fixed by the number of discrete classes.
Auto Range Select to automatically determine the minimum and maximum data range. Otherwise, deselect this option and manually specify the ranges in the Min and Max boxes.
Save to manager Click this button to save the current histogram to the Statistics Manager. You can give the histogram a name when you save it. Saved histograms can be used in the Property Calculator and Property Modeling processes as input data.
Using the Histogram View context menus
Right-clicking on the view displays a context menu that provides several options to specify the histogram and the chart area. Depending on the position in the view you access the context menu from, the following options are available:
Unit Click on an axis to view the Unit menu, from which you can select the display unit (ft, km, m, %, etc.).
Format Select the display format of the selected axis. With the Auto setting, a format that fits the data set is automatically selected.
Options Modify the chart settings of the histogram. The Options Dialog opens at the relevant element, depending on the position clicked. See Chart options.
Export Use this option to export the data to clipboard so that it can be pasted into other applications.
Color Use this option to change the color of the bins.
Annotations Select this to display the number of samples contained in a bin.
Using the histogram toolbar
The Histogram toolbar contains buttons used to show or hide different parts of the histogram, control the zoom level, and capture the view for use in other applications.
|
|
Show/hide settings panel Display or hide the Settings panel. With the Settings panel hidden, the chart area fills the whole of the plot view. |
|
|
Show/hide normal distribution Display or hide the normal distribution curves in the histogram. |
|
|
Show/hide chart legend Display or hide the legend. |

|
Copy view content to clipboard Copy the view to the clipboard so that you can paste it into another application. |

|
Save view to file Save the view as an image file such as a *.jpg, *.png, or *.tiff. |

|
Zoom in Zoom in on the view. |

|
Zoom out Zoom out of the view. |
|
|
Reset zoom Reset any zoom changes back to the original view. |

|
Probe (shortcut key: Ctrl+I) When selected, you can hover over any part of the chart to view additional details such normal distribution values. |