Variogram maps - general info
To calculate a variogram, it is important to first determine the major direction. The major direction is defined as the direction of the largest spacial continuity. The variogram map is a valuable tool to find this direction. On the map, it is the direction where the change in color is smallest.
The variogram map allows you to rapidly determine the presence of anisotropic spatial continuity and model your variogram(s) accordingly. The variogram map is a directional semi-variance chart. Other than the term 'map' may suggest it does not relate to actual locations on a map or in the reservoir. The variance map is a 2D plot of lag size versus azimuth with the semi-variance shown as color-gradient. The variogram map shows you how the semi-variance changes with direction.
The variogram map is symmetric to its origin. As a mind game you can imagine the semi-variance values of a N-S variogram to be plotted: as you move a away from the origin of the plot the semi-variance starts to increase until the sill is reached. Now do the same for multiple directions and the variogram map starts to fill up. In an isotropic case you would see a circular feature in the middle of the plot with a radius equal to the range. In this case you would probably decide to go with a single, omni-directional variogram model. In an anisotropic case with the largest spatial continuity in N-S direction and a shorter range in the E-W direction, you would see an ellipsoid feature with the longer axis in N-S direction.
Based on the variance, you can now graphically adjust the direction of the arrow to align with the major direction (largest spatial continuity). In a second step you can graphically adjust the size of the ellipsoid (attached to the arrow) to match the shape of the features. The extent of the feature (circular or ellipsoid) represents the ranges. In practice you will encounter more complex cases in which the variograms will have 'hole effects' which then lead to contoured features on the variogram map. These should not be confused with local features on the map as the variogram map is not related to coordinates.
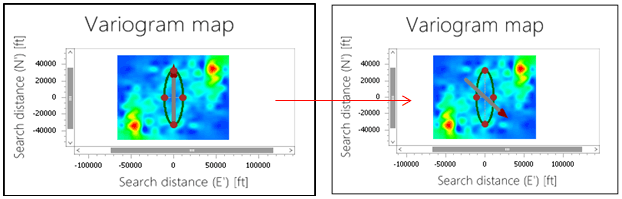
Changing the azimuth of the major direction click to enlarge