Viewing maps and reports
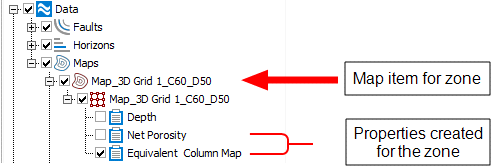
Map item and properties in the JewelExplorer click to enlarge
For each form in the Model Reporting button group (model > Maps & Reports) you can generate a map property and view it in a 2D view. The properties generated via these forms are located in the JewelExplorer under the Data > Maps folder. As each of the properties are created for a specific zone in a 3D grid, a map item named after the zone is created when the first property is generated. For example, a property created in the Thickness form for Zone A will create a map item named 'Map_Grid 1_Zone_A' under the Data > Maps folder in the JewelExplorer. Under each map item in the JewelExplorer you will find the properties created for the associated zone. For example, if you have executed the functionality in the Net Porosity and Column forms you will find the Net Porosity and Equivalent Oil Column Map properties under the map item for the zone (see image).