The JewelSuite Subsurface Modeling workspace
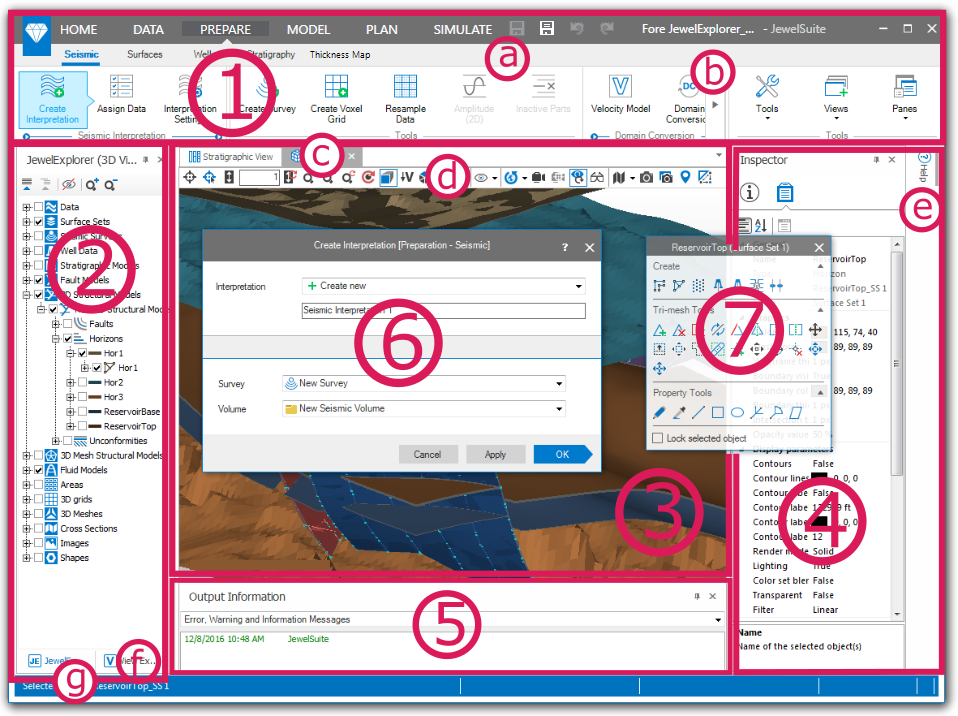
The JewelSuite Subsurface Modeling workspace. (1) The Strip. (2) The JewelExplorer. (3) View area. (4) Pane area. (5) Output information. (6) A form. (7) Floating palette. (a) shows the quick access toolbar, (b) an arrow that reveals the rest of the strip, (c) the view tabs, (d) a view toolbar, (e) auto-hidden panes, (f) tabs at bottom on pane, and (g) the status bar. click to enlarge
At each stage throughout your work, JewelSuite Subsurface Modeling aims to provide the functionality you need as and when you need it, and offer easy access to all the reports, views and tools, to complete what you want to do quickly and easily.
As you work through all the steps, from importing your data to simulation and reporting, you will often be following sequences of actions in a particular order, or workflows. The Strip (1) at the top of the application is intended to be your guide through these workflows as well as giving you access to the functionality and tools you need to refine your model.
Along with a quick access toolbar (a) that lets you quickly undo and redo steps and save your work, at the top of the Strip are the main items. home is where you perform general tasks, such as opening and saving files, managing your settings and accessing the documentation. When you need to import or export any data, you will use the data strip. With the prepare strip, you create, edit and prepare one or more consistent set(s) of data which will form the input to the modeling. model is where you will follow all the workflows and steps to create 3D structural models, add properties, create 3D grids and prepare volumetrics and other reports. With the concept strip you can create conceptual models for volumetric calculations, including (quantified) parametric and conceptual uncertainties. You can use these concepts as input to probabilistic calculations that you perform with the study strip. The simulate strip is where you will perform simulations on your model. The jewellabs strip contains a separate experimental set of add-in products that work with JewelSuite. You are given permission and license to use the JewelLabs add-ins, but they are provided only on an 'as is' basis, without warranty, support or upgrades.
When you select one of the main Strip items, sub-items appear. These are ordered from left to right in the sequence that you will typically follow. For example, the first step in modeling (after you have imported and prepared your data) is to create a fault model, and typically the last steps in modeling will involve volumetrics calculations and reporting.
As you click the sub-items, the bottom part of the strip shows a strip with buttons relating to that sub-item. The buttons are arranged in groups. On the left is usually a workflow group, which contains a sequence of steps to complete what is required for that strip. Where you are in this workflow at any particular time is highlighted. At the right side of the workflow group are various tools that may also be useful to you in completing the strip. And on the far right is the general Workspace group, which allows you to show or hide the views and panes and gives you access to various editing tools on floating palettes.
If the application window is not wide enough to display all the main Strip or sub-strip items or buttons, small arrows appear (b) on both sides. You can access the hidden items or buttons as you hover the mouse over the arrows.
Quick access toolbar
You can use the buttons in the quick access toolbar (a) to save your solution ![]() and
and ![]() , or to undo
, or to undo ![]() or redo
or redo ![]() your actions. Use the General settings form (HOME > Settings > Options > General) to change the number of commands that will be stored for undo and redo purposes.
your actions. Use the General settings form (HOME > Settings > Options > General) to change the number of commands that will be stored for undo and redo purposes.
The Jewel icon
You can click and drag the Jewel icon on the top-left corner to move the application window. You can also use the options via the context menu of the Jewel icon.
JewelExplorer and more...
On the left of the screen is the explorer area (2), where the JewelExplorer (a key organizational and visualization tool) and various other explorers are shown. You can switch between these using the tabs at the bottom of this area (f). In the center of the screen is the view area, where you can visualize your data and models. You can have various views open at the same time and switch between them using the tabs at the top of the view area (c). At the top of each view is a toolbar (d) with buttons for various options and tasks you may want to perform while displaying the view. At the right side of the screen is the Inspector pane. You can view different information in this pane by clicking the buttons at the top (e). Click the Property Inspector  icon to view detailed information about any item you have selected in the JewelExplorer or have clicked in your view.
Panes on the sides of the application can be made to autohide themselves to give you more screen area when you are not using them. In this case, they will collapse into the workspace margin (e). Click on them here to have them appear again. To stop a pane autohiding and dock it in the workspace, click the horizontal pin ![]() icon at the top of the pane. See Using the panes for more on this.
icon at the top of the pane. See Using the panes for more on this.
At the bottom of the screen is another area where warning and information messages, other explorers and controls may be shown. You can select which one to display using the tabs at the bottom of the pane (5).
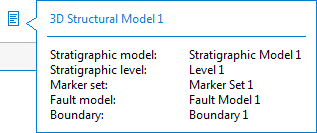
A factsheet click to enlarge
When you click on a button in the Strip or other parts of the application, a form will often be shown to allow you to enter selections and other information relating to the current task (6). In some cases, the selected model you work on is based on other models or cases, which might result in dependencies that are not always visible. To provide quick and easy access to this information you can hover over the factsheet icon ( ) at the top of the form. On this factsheet you will see the name of the selected model or case, and below the blue line all the data/models that are assigned to it.
If the form is part of a workflow, the OK button will have an arrow, and when you click this the form relating to the next step in the workflow will be automatically shown. Clicking the Apply button will apply your changes, but the next form will not automatically be shown. The OK button will change into a NEXT button.
In the title bar of all forms, you will find a ? icon. Clicking this icon opens the dynamic help, if it is not already open. To find information on other topics as well, you can drag the help pane wider and use the search functionality, or use the table of contents.
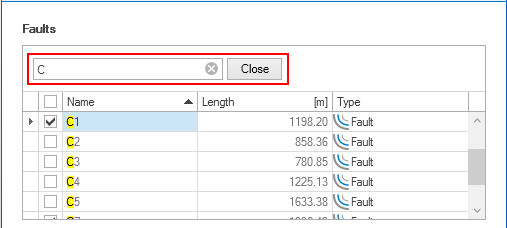
Search functionality is available for tables on a form click to enlarge
Forms that contain one or more tables, have search functionality for these tables. To enable the search functionality, first click inside the table. Use the Ctrl+F key combination to activate the search functionality. Type an entry, the search will start immediately. The search functionality acts as filter, only those entries that contain the search term are listed in the table. Press Esc or click Close to close the search and remove the filter from the table.
Various tools are also available in the floating palette (7). The contents of the palette will depend on what you are currently working on in your view. You can show and hide the floating palette by choosing the Editing Tools in the Tools drop-down list at the right of the strip.
Finally, the status bar at the bottom of the screen (g) provides information about the status of the application such as loading progress, current objects, calculation status and recent updates.