Perforation Optimization
The perforation optimization sub-strip helps you to understand and select the best orientation perforation according to the input data. After defining the depth of study on the Source Depth form, four different workflows are available for the assessment. In all four, the variable to be studied can be defined as single, regular or custom.
Simulates the wellbore conditions, for a known rock strength under different reservoir pressure (depletion behavior).
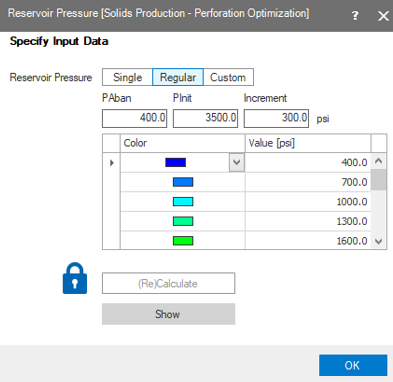
The studied variable is reservoir pressure click to enlarge
TWC Strength is the inverse of the Reservoir Pressure workflow: TWC Strength simulates the behavior of the rock strength knowing the depletion value.
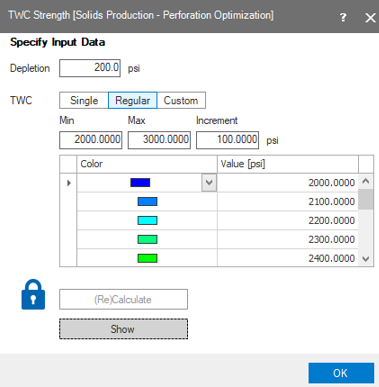
The studied variable is TWC strength click to enlarge
Wellbore Azimuth simulates different wellbore azimuths with the desired depletion.
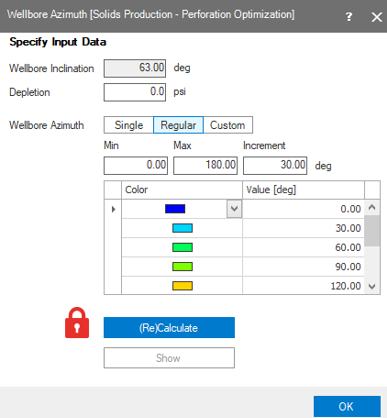
The studied variable is wellbore azimuth click to enlarge
Use this form to simulate different wellbore inclinations with the desired depletion.
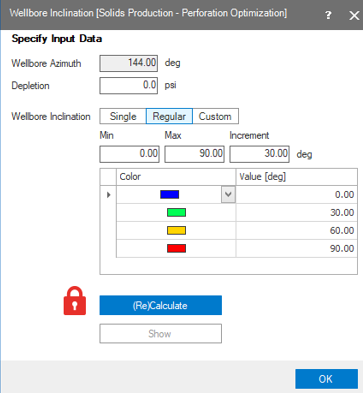
The studied variable is wellbore inclination click to enlarge
After changing your input settings, click (Re)Calculate. To view the results, click Show. This opens a Perforation Optimization view, where all variables are displayed.
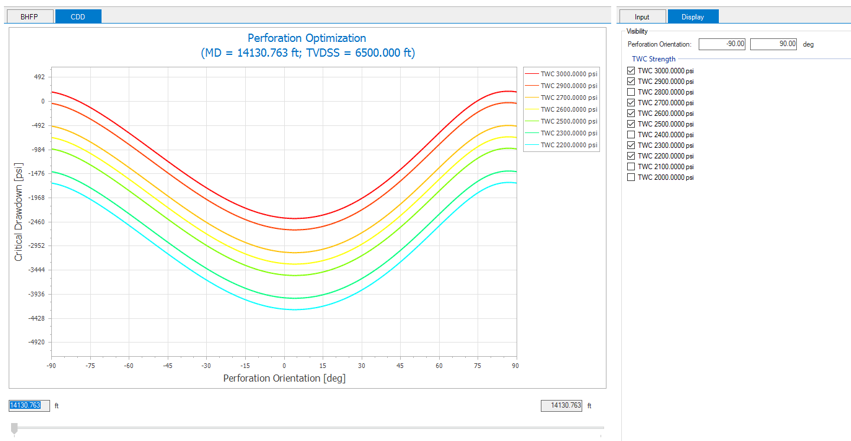
This view has two tabs: The Critical Bottomhole Flowing Pressure (CBHFP) and the Critical Drawdown Pressure (CDD)which are the output variables (logs), able to be displayed.
Perforation Optimization view toolbar

|
Probe Displays information for the location that the cursor is hovering over. |

|
Take screenshot Copy the current view to the clipboard for use in other applications. |

|
Save screenshot to file Save the current view to a file with a name and location you specify. |

|
Zoom in Incrementally zoom in on the view. |

|
Zoom out Incrementally zoom out on the view. |
|
|
Zoom rectangle Turns the cursor into a zooming tool. When this option is active, click and drag a box around the data you want to view in better detail. |
|
|
Zoom on both axes Incrementally zooms in equally along both axes. |
|
|
Zoom on the horizontal axis Zooms the view only along the horizontal direction. |
|
|
Zoom on the vertical axis Zooms the view only along the vertical direction. |
|
|
Reset zoom Clear all zoom changes. |
|
|
Export to clipboard Copies the numerical chart data to the clipboard, allowing it to be pasted into external applications. |

|
Export to file Exports the plot data to a *.txt file. |
|
|
Options Opens the Input and Display section at the right side of the screen. |
Click on the Options icon ![]() to open the Input and Display section. The input tab lets you change any variable used in the workflow. When a variable has been changed, the lock icon on the respective form appears closed red. To accept the changes, open the lock.
to open the Input and Display section. The input tab lets you change any variable used in the workflow. When a variable has been changed, the lock icon on the respective form appears closed red. To accept the changes, open the lock.
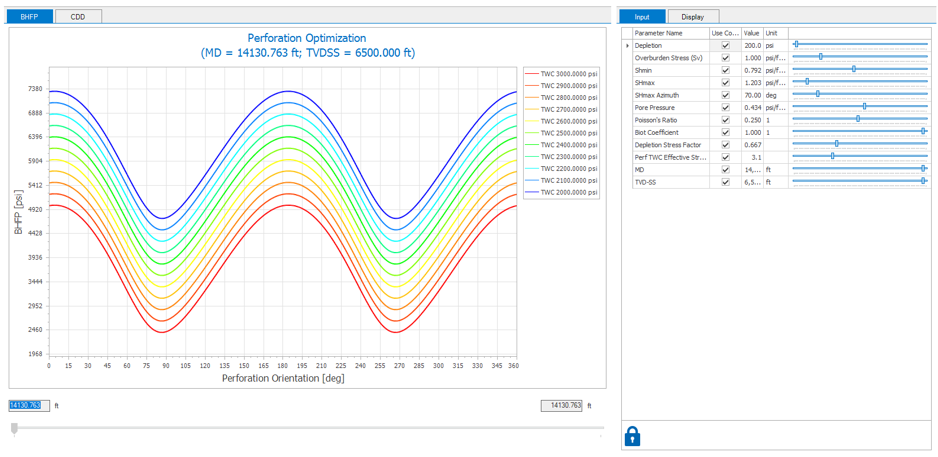
The CDD tab show the results of the critical DD vs perforation orientation. Using the Display tab you can manipulate the visibility of the simulated data and also the scale of the orientation perforation. This could be from 0 to 360, from 0 to 180 or from -90 to 90.