Polar Plot
The Polar Plot sub strip establishes the optimum well trajectory for open hole completions. This requires that the target depth be defined.
The Source Depth form lets you define the study as either log based or depth based. Notice that for log based, any interval could be defined.
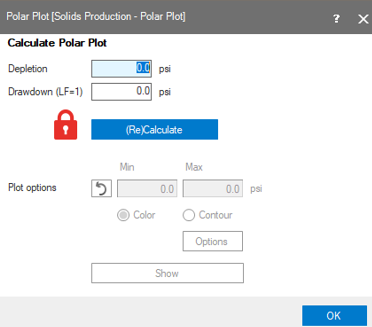
After you enter your input data, click (Re)Calculate, The result is the polar plot where three variables can be displayed as output: Critical BHFP, critical drawdown and load factor.
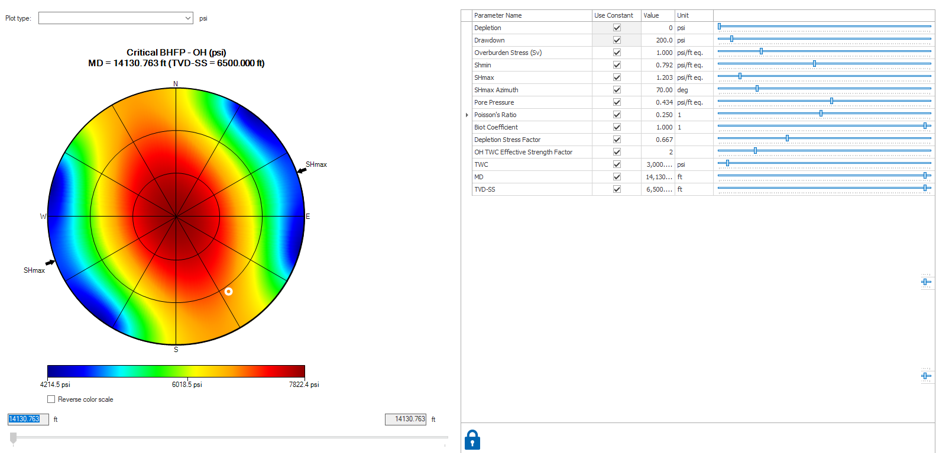
The figure above shows the effect of the drilling direction on the critical BHFP, critical drawdown, and load factor. Red areas represent high risk zones while blue areas show less risk zones. In this particularly case, the polar plot show that for an open hole completions with these specific depletion and drawdown conditions, the best trajectory should be parallel the direction of SHmax.